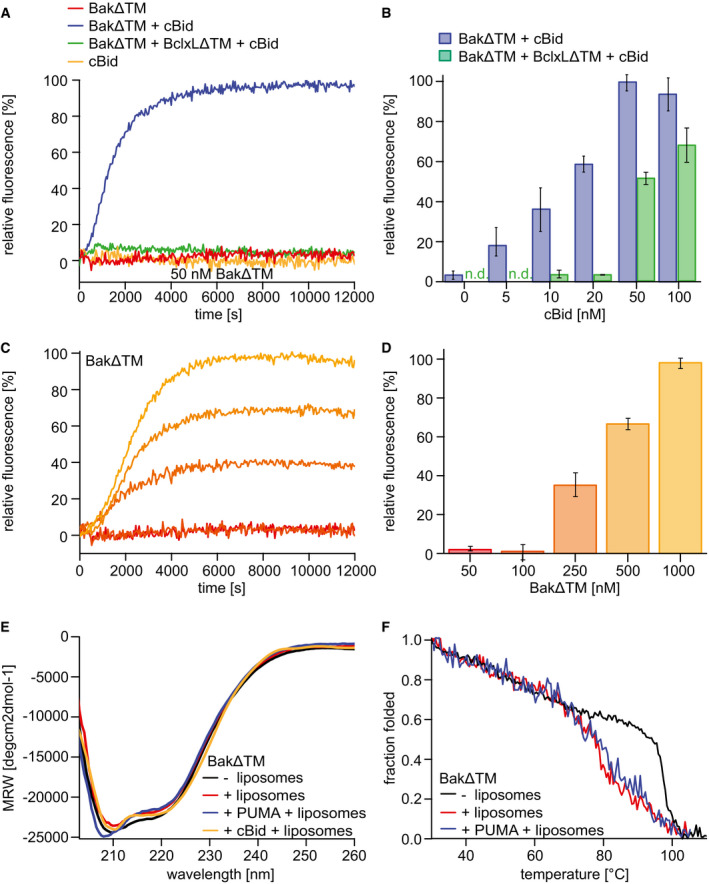
Figure 1. Functional and biophysical characterization of BakΔTM bound to liposomes.

-
A–DLiposome permeabilization assays detecting the release of a fluorescence dye from liposomes. (A) Pore formation of 50 nM BakΔTM (red) is activated by 20 nM cBid (blue). 20 nM cBid alone (orange) shows no liposome permeabilization. Addition of 25 nM BclxLΔTM (green) inhibits pore formation. (B) Increasing amounts of cBid are titrated to 50 nM BakΔTM in the absence (blue) and presence (green) of 25 nM BclxLΔTM. (C,D) BakΔTM becomes autoactive at increasing concentrations. The concentrations are color‐coded as indicated in (D). (C) The averaged kinetics for increasing BakΔTM concentrations. Bar diagrams in (B) and (D) represent data from the kinetic experiments averaged between 9,000 and 10,000 s. The standard deviation was calculated from three measurements.
-
EFar‐UV‐CD spectra of BakΔTM ± liposomes and the activators cBid or Puma‐BH3 peptide as indicated.
-
FCD‐detected thermal melting experiments of BakΔTM (black) with liposomes (red) and Puma‐BH3 (blue).
