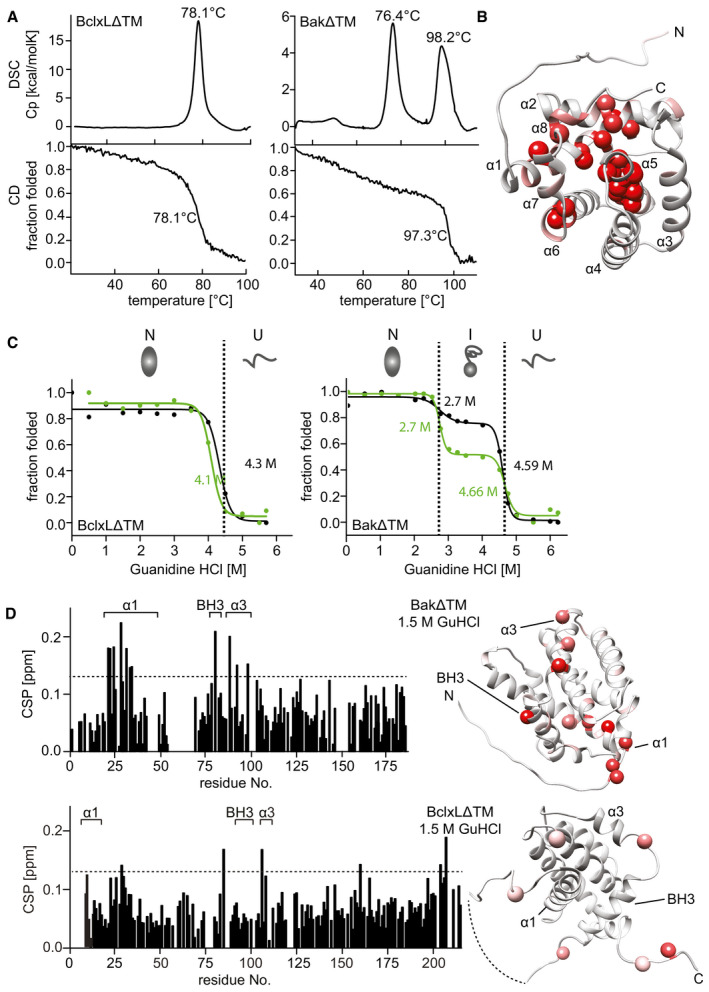
Figure 3. Stability of the Bak and BclxL soluble domains.

- Comparison of the thermal stability of BclxLΔTM (left) and BakΔTM (right) measured by DSC (top) and Far‐UV‐CD at 222 nm (bottom).
- RDC‐refined structure of BakΔTM. The NMR peak height ratio of the deuterated vs. protonated sample was used to identify solvent‐protected amino acid residues (red spheres).
- Comparison of the GuHCl‐induced chemical unfolding of the secondary structure (black), monitored by far‐UV‐CD at 222 nm, and tertiary structure (green), monitored by Trp‐fluorescence, of BclxLΔTM (left) and BakΔTM (right). The native (N), intermediate (I), and unfolded (U) states are indicated at the top.
- Chemical shift perturbation (CSP) plot derived from 2D‐[15N, 1H] HSQC spectra of BakΔTM (top) and BclxLΔTM (bottom) ± 1.5 M GuHCl. The most significant chemical shift perturbations (> mean value plus standard deviation, dotted line) are highlighted in red on the structures on the right.
