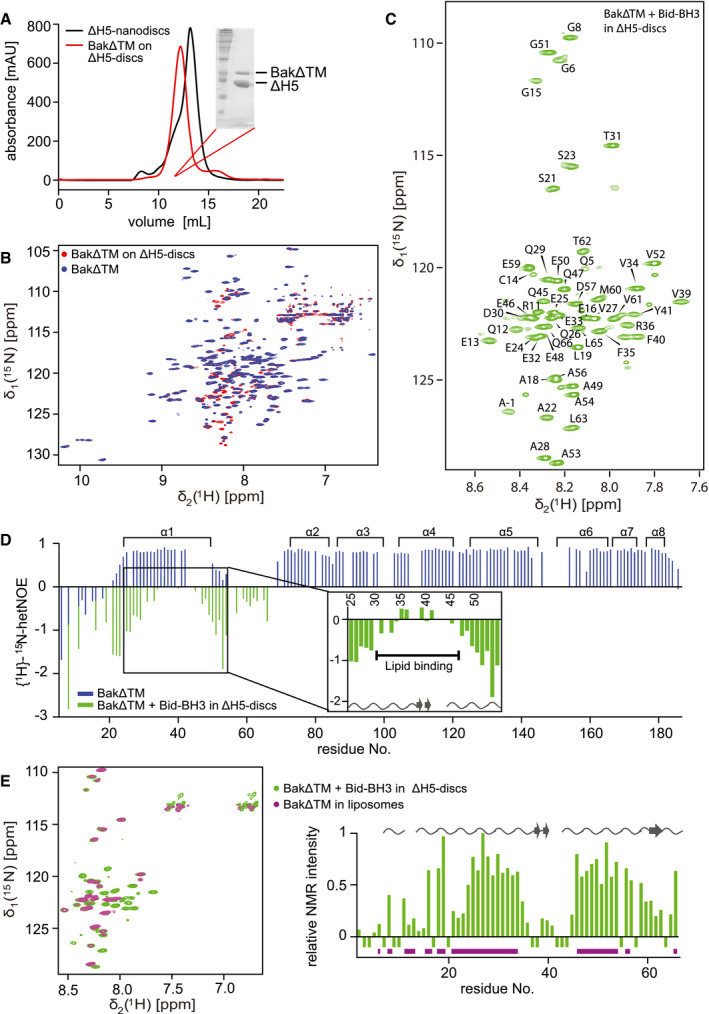
Figure 4. NMR analysis of activated BakΔTM on lipid nanodiscs.

- Size exclusion chromatogram of nanodiscs (black) and BakΔTM bound to nanodiscs (red). Inset: SDS–PAGE confirms the presence of Bak‐loaded nanodiscs.
- Overlay of 2D‐[15N, 1H]‐TROSY spectra of BakΔTM with (red) and without (blue) nanodiscs.
- 2D‐[15N, 1H]‐TROSY spectrum of BakΔTM in nanodiscs after Bid‐BH3 activation with the assigned resonances indicated.
- {1H}–15N‐heteronuclear NOE of BakΔTM in the inactive state (blue) and the active state in nanodiscs after Bid‐BH3 activation (green). α‐Helices in Bak are shown at the top. Residues 25–54 of the activated state are magnified. Chemical shift‐derived secondary structure elements are indicated at the bottom.
- Left: Overlay of 2D‐[15N, 1H]‐TROSY spectra of BakΔTM in [Ni2+]‐caged liposomes (magenta) and Bid‐BH3‐activated BakΔTM in nanodiscs (green). Right: Plot of the relative NMR intensity of Bid‐BH3‐activated BakΔTM in nanodiscs. Peaks that are also visible in liposomes are indicated by horizontal lines in magenta at the bottom, while the chemical shift‐derived secondary structure elements are indicated at the top.
