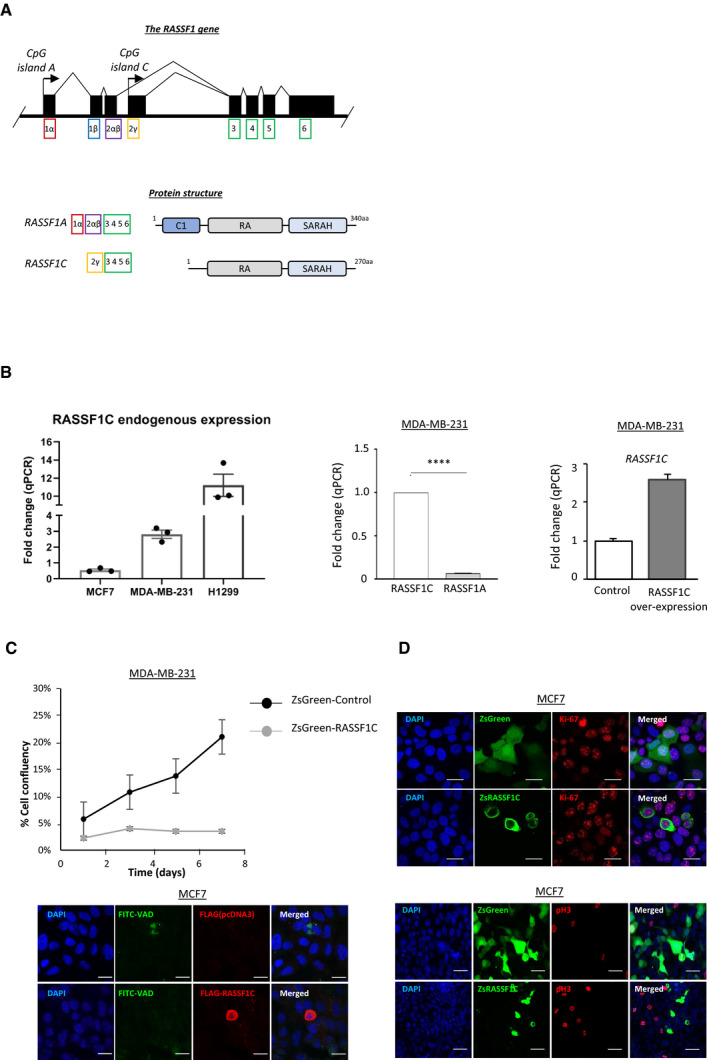
Figure EV1. RASSF1C oncogene is responsible for MAT.

- Schematic representation of the RASSF1 gene locus (top) and protein domains of the two main RASSF1 isoforms (bottom). Top: black boxes represent exons, black arrows represent CpG island promoters. Bottom, RASSF1A transcript contains six exons (1α, 2αβ, 3, 4, 5, and 6) and is translated to a protein with 340 aa. The RASSF1C variant is transcribed from an intragenic CpG island and consists of five exons (2γ, 3, 4, 5, and 6) and is translated to a protein of 270 aa. Bottom: at the protein level, RASSF1A and RASSF1C both encode for a RA (Ras Association) domain and a C‐terminal SARAH (Sav/RASSF/Hpo) domain. RASSF1C however lacks the C1 (protein C kinase conserved) region at the N‐terminal, which is present in RASSF1A.
- Left: fold change of qRT–PCR for endogenous RASSF1C expression in the cells lines used in this study is shown. Middle: fold change of qRT–PCR for RASSF1C and RASSF1A mRNA in MDA‐MB‐231 cells are shown. Right: MDA‐MB‐231 cells were transfected with a Control (pcDNA3) or FLAG‐RASSF1C plasmid and mRNA levels of RASSF1C were analyzed via qRT–PCR. Data show a 2.5‐fold increase in RASSF1C mRNA upon over‐expression.
- MDA‐MB‐231 cells stably expressing either a ZsGreen‐Control or ZsGreen‐RASSF1C construct were FACS sorted for greenhigh expression, re‐seeded, and kept in 2D culture for the following 7 days. Confluency was measured by taking a picture every other day for 7 days and quantifying the amount of green fluorescent cells.
- Confocal images of MCF7 cells transiently transfected with ZsGreen or Flag constructs and stained after 72 h for Ki‐67 (red) expression, FITC‐VAD (green), and Flag (red), phospho‐Histone 3 (red) and DAPI (blue). Scale bars represent 10 μm (Ki‐67 and FITC‐VAD panels) and 20 μm (pH3 panel).
Data information: Data are analyzed by Student’s t‐test and represented as mean ± SEM. ****P ≤ 0.0001, n = 3.
Source data are available online for this figure.
