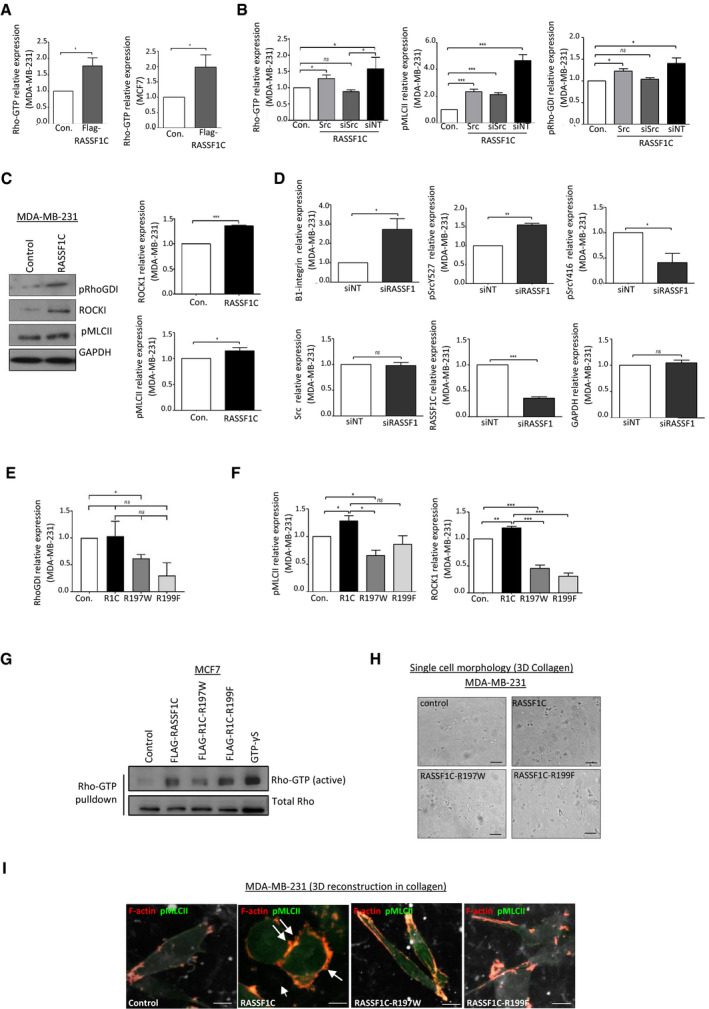
Figure EV2. RASSF1C promotes Rho/ROCKI signaling and amoeboid morphology.

- Quantification of Western blot analysis, related to Fig 2A.
- Quantification of Western blot analysis, related to Fig 2B.
- Western blot analysis and quantification of protein expression in MDA‐MB‐231 cells transiently transfected with an empty vector or a RASSF1C construct. GAPDH was used as a loading control.
- Quantification of Western blot analysis, related to Fig 2C.
- Quantification of Western blot analysis, related to Fig 2F.
- Quantification of Western blot analysis, related to Fig 2G.
- Active Rho‐GTP pull‐down assay from MCF7 cells transfected with Control, FLAG‐RASSF1C, FLAG‐RASSF1C‐R197W, or FLAG‐RASSF1C‐R199F plasmids.
- Maximum Intensity Projection of confocal images of MDA‐MB‐231 cells grown in 3D collagen and transfected with ZsGreen, ZsRASSF1C wild‐type or mutant plasmids. Cells were stained with phalloidin for F‐actin (red) and pMLCII (far red, false‐colored to green). Arrows indicate site of cell blebbing. Scale 5 μm.
Data information: Data are analyzed by Student’s t‐test and represented as mean ± SEM.*P ≤ 0.05, **P ≤ 0.01, ***P ≤ 0.001, n = 3.
Source data are available online for this figure.
