
Figure 5. RASSF1C oncogene induces invasion and metastatic dissemination via EV transfer in vivo .
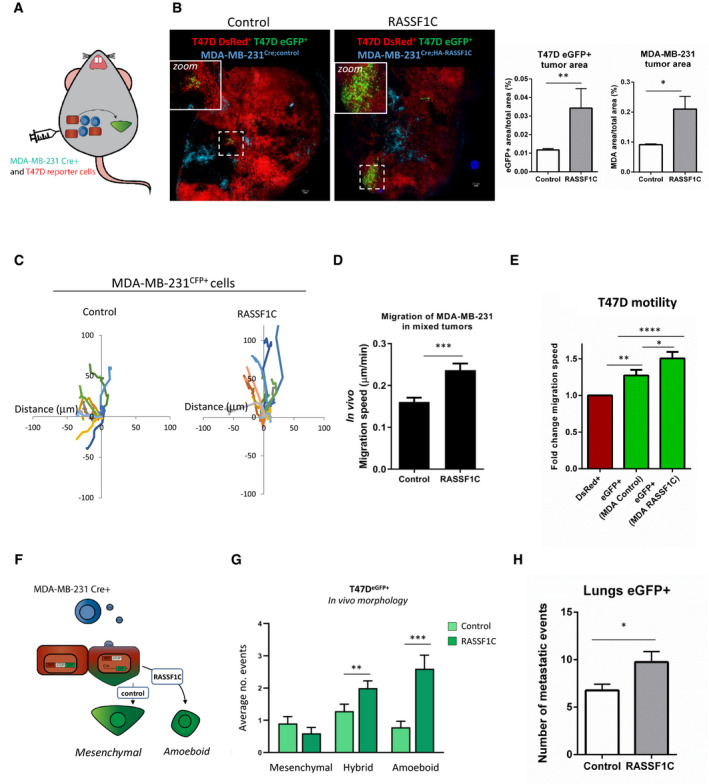
- Cartoon of in vivo experimental approach. MDA‐MB‐231CFP;Cre and reported T47DDsRed cells were co‐injected in one mammary gland of 10 mice per experiment.
- Left: representative confocal images of mammary tumor formed by the co‐injection of T47DDsRed reporter cells with either MDA‐MB‐231CFP;Cre;Control or MDA‐MB‐231CFP;Cre;HA‐RASSF1C. Scale 200 μm. Right: averaged values for all mice for the percent of the eGFP+ or CFP+ cells as part of the whole tumor.
- Representative 3 h migration paths of either MDA‐MB‐231CFP;Cre;Control (Control, left) or MDA‐MB‐231CFP;Cre;HA‐RASSF1C (RASSF1C, right) within a single intravital imaging field of tumors co‐injected with T47DDsRed reporter cells.
- In vivo migration speed of MDA‐MB‐231CFP;Cre;Control or MDA‐MB‐231CFP;Cre;HA‐RASSF1C in a mixed tumor with T47DDsRed cells. Values are an average of the totals from 5 mice each, measured from intravital time‐lapse images.
- The normalized in vivo motility of T47DeGFP and T47DDsRed reporter cells in mixed tumors. A Non‐parametric Mann‐Whitney U test was used to derive statistical significance.
- Cartoon representing the Cre‐LoxP model exploited to follow up amoeboid motility in recombined reporter (T47DeGFP) cells.
- Quantification of distinct morphology of T47DeGFP in tumors from observed from a total of 30 positions in n = 5 mice/group (Control or RASSF1C). Mesenchymal, amoeboid, or hybrid motility was scored manually as described in Fig 1K.
- Quantification of the number of T47DeGFP metastatic events found in the lungs of mice with mammary gland tumors. Whole lung tile images were used for quantification, 6 of 10 μm sections each, 100 μm apart.
Data information: All data are from n = 3 independent experiments. Data are analyzed by Student’s t‐test and represented as mean ± SEM.*P ≤ 0.05, **P ≤ 0.01, ***P ≤ 0.001, ****P ≤ 0.0001.