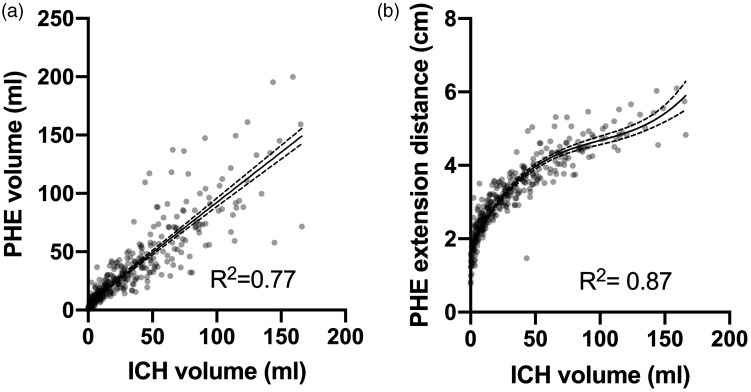
Figure 2.
Scatterplots and regression analyses of ICH volume vs. PHE volume (a) or EED (b). Dots represent individual patients, solid lines represent the modeled regression line, and dashed lines indicate 95% confidence intervals. R2 represents the proportion of the variance for the dependent variable that is explained by the independent variable in the regression models.

