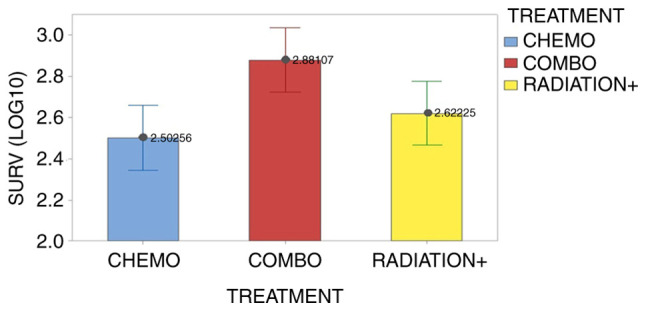
Figure 2.

Effect of treatment type on the mean survival patients (log10 transformation). Vertical bars denote the 95% confidence intervals of the means based on the error mean square of ANOVA. The pooled standard deviation was used to calculate intervals. Chemo, chemotherapy; Combo, combined; Radiation+, radiation therapy combined with chemotherapy.
