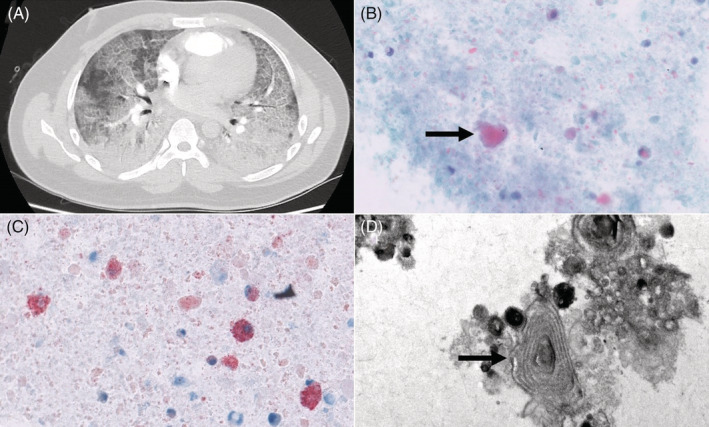
FIGURE 1.

(A) Computed tomography scan showing ground‐glass changes with interlobular septal thickening (crazy‐paving pattern). (B) Amorphous globular structures that stained orange to green (arrow) (Papanicolaou stain, original magnification ×400). (C) Numerous lipid‐laden macrophages and droplets of fat in the background (Oil‐Red‐O stain, original magnification ×400). (D) Lamellar bodies (arrow) seen on electron microscopy (original magnification ×15,000)
