FIGURE 1.

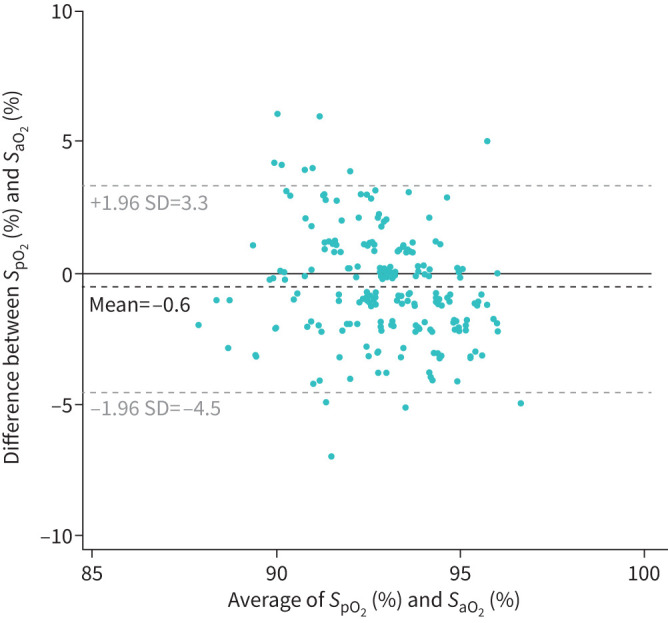
Bland–Altman diagram: agreement between pulse oximetry saturation (SpO2) and arterial oxygen saturation (SaO2) in the cohort of patients with isolated nocturnal oxygen desaturation (n=240).

Bland–Altman diagram: agreement between pulse oximetry saturation (SpO2) and arterial oxygen saturation (SaO2) in the cohort of patients with isolated nocturnal oxygen desaturation (n=240).