Figure 4.
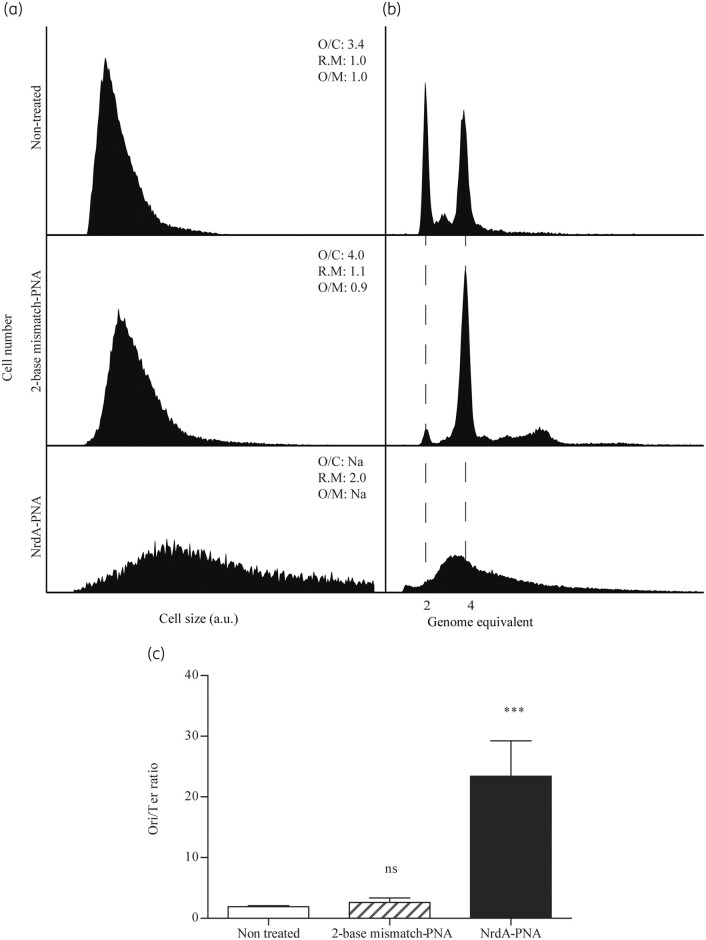
Cell cycle analysis of NrdA-PNA treated cells. WT E. coli cells were grown exponentially in AB medium and diluted to OD450 = 0.05 and treated with NrdA-PNA (8 μM, bottom panels) or 2-base mismatch-PNA (8 μM, middle panels) or left non-treated (top panels) for 2 h prior to sample collection and flow cytometry and quantitative PCR analysis. (a) Cell size distribution of exponentially growing cells. (b) DNA content of cells treated for 4 h with rifampicin and cefalexin for chromosome replication to complete. The number of fully replicated chromosomes reflects the cellular number of origins at time of drug treatment, indicated by hatched lines.19,21,22 Panels represent 30–50 000 cell events for each condition. The average oriC/cell (O/C), relative mass (R.M) and oriC/mass (O/M) relative to WT are inserted in the panels. (c) ori/ter ratios were determined by quantitative PCR of oriC and terminus regions on exponentially growing cells. Shown is the mean±SD based on three determinations. All ratio values were normalized to the ori/ter ratio of a stationary-phase MG1655 culture, when cells contain fully replicated chromosomes and hence an ori/ter ratio of 1. ns, not significant; ***, P<0.01.

