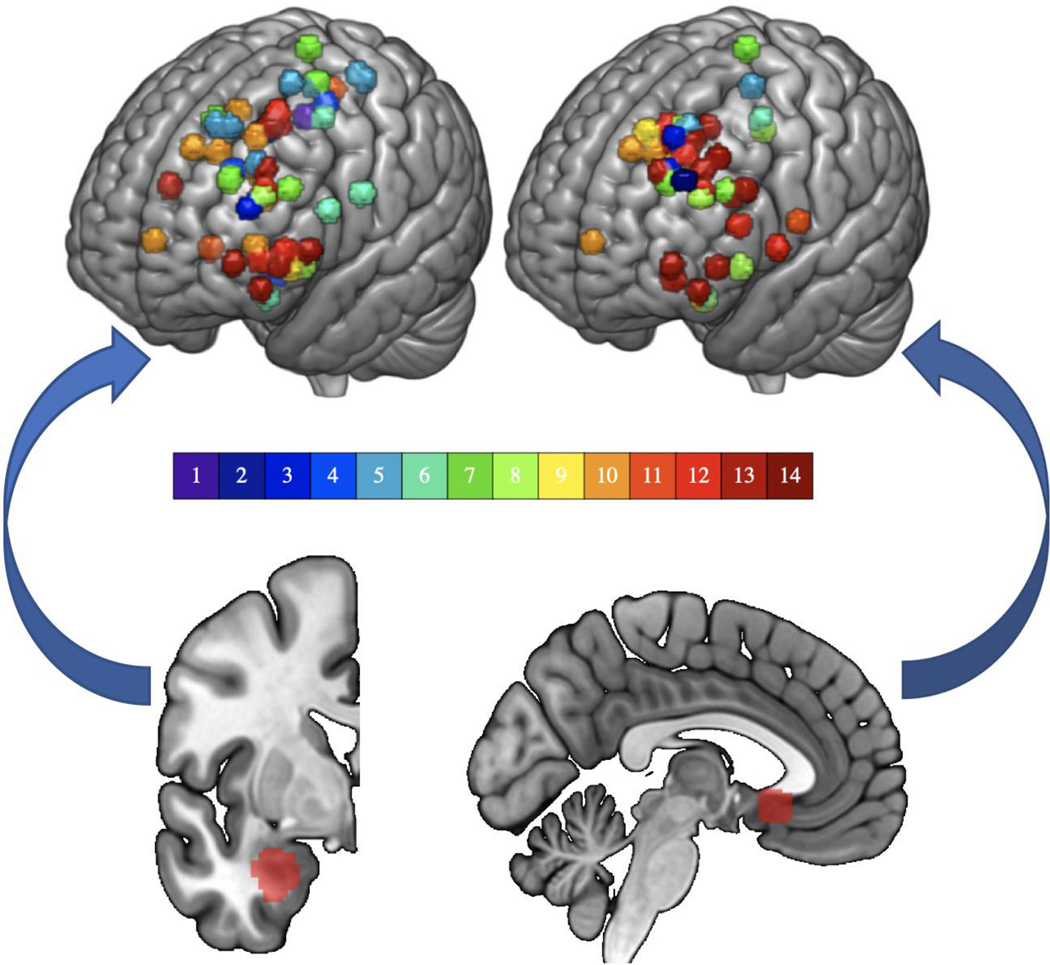
Fig. 1. Sites of stimulation and downstream targets.
(A) Stimulation sites (top) based on resting fMRI seeded from the subcortical region below it (bottom). On the left, the basolateral amygdala (BLA) and on the right, the subgenual anterior cingulate cortex (sgACC). Colorbar represents subject number. The sgACC is displayed at MNI x= −4 and the left BLA is displayed at MNI y= −2.

