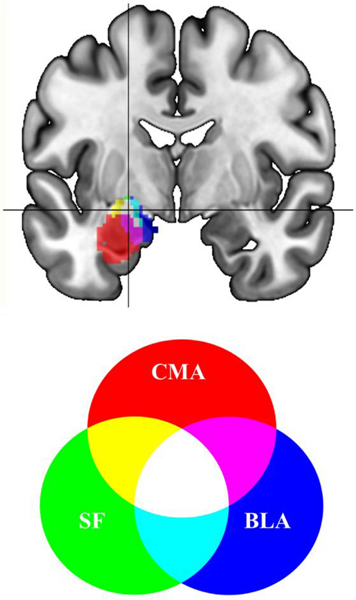
Fig. 6. Peak amygdala response to TMS.
In a combined basolateral (blue), centromedial (red) and superficial (green) amygdala volume, the peak average response (FDR corrected; p<.05) at MNI xyz (−20, −6, −12) is indicated by the crosshairs and represents a coordinate with 78% SF, 68% BLA and 56% CMA probability based on an histology generated atlas.

