
Figure 2.
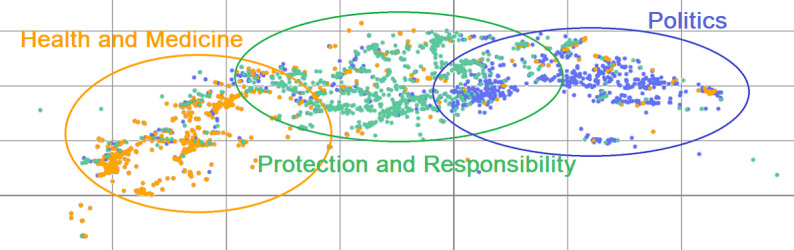
A t-distributed stochastic neighbor embedding graphical representation of the 3 topic clusters with 1000 most frequent n-grams (n ∈ [1;4]). Orange, seafoam (green-blue facilitating reading of the figure by color-blind individuals), and violet represent “health and medicine (biological and clinical aspects),” “protection and responsibility,” and “politics,” respectively.