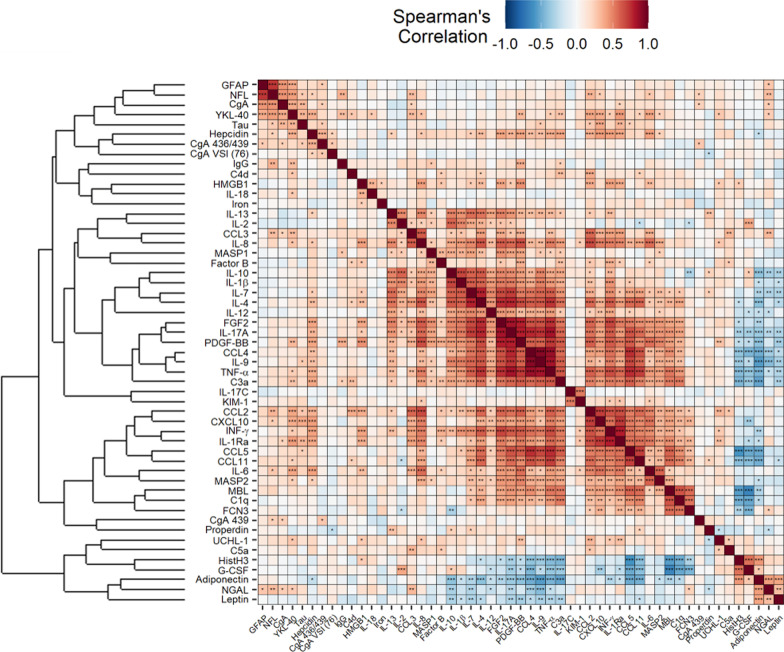
Fig. 6.
Spearman’s correlations between biomarker levels and hierarchical cluster analysis. The magnitude of each correlation is denoted with a color, whereby the red color indicates a positive correlation and blue color represents a negative correlation, such that the deeper the color, the stronger is the correlation. IgG = anti-SARS-CoV2 spike 1 IgGs. Levels of statistical significance with false discovery rate (FDR) correction are denoted as: p < 0.05, *p < 0.01, ***p < 0.001

