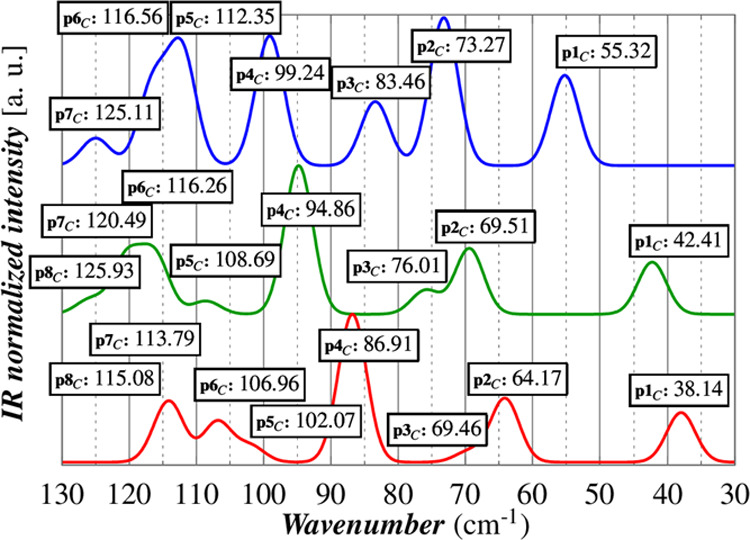
Figure 5.

DFT vibrational analysis of 10K,cell–opt (blue), 1100K,opt (green), and 1300K,opt (red). A direct comparison of experimental and calculated spectra is available in the SI (Figure S5).

DFT vibrational analysis of 10K,cell–opt (blue), 1100K,opt (green), and 1300K,opt (red). A direct comparison of experimental and calculated spectra is available in the SI (Figure S5).