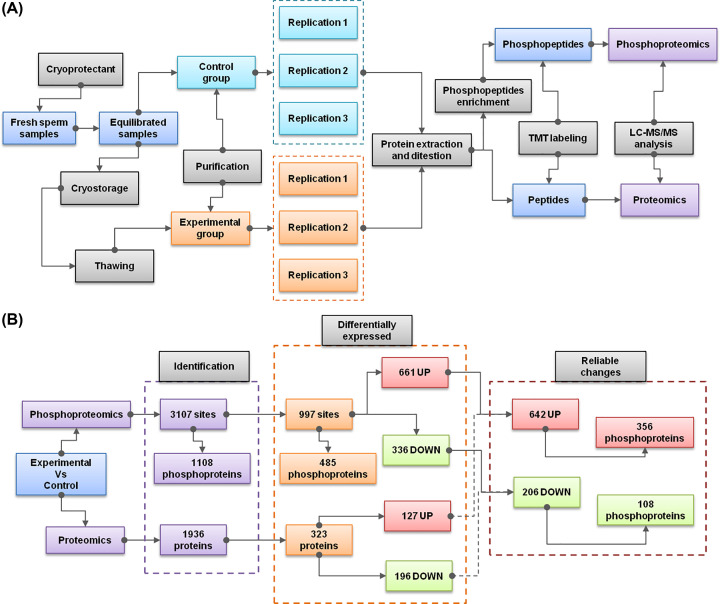
Figure 2. Schematic diagrams of the experimental design and summarized results.
(A) The overall experimental design including sample grouping, sample processing, phosphoproteomics procedure, and proteomic procedure. (B) Summary of the identification and statistical results of phosphoproteomics and proteomics analysis.

