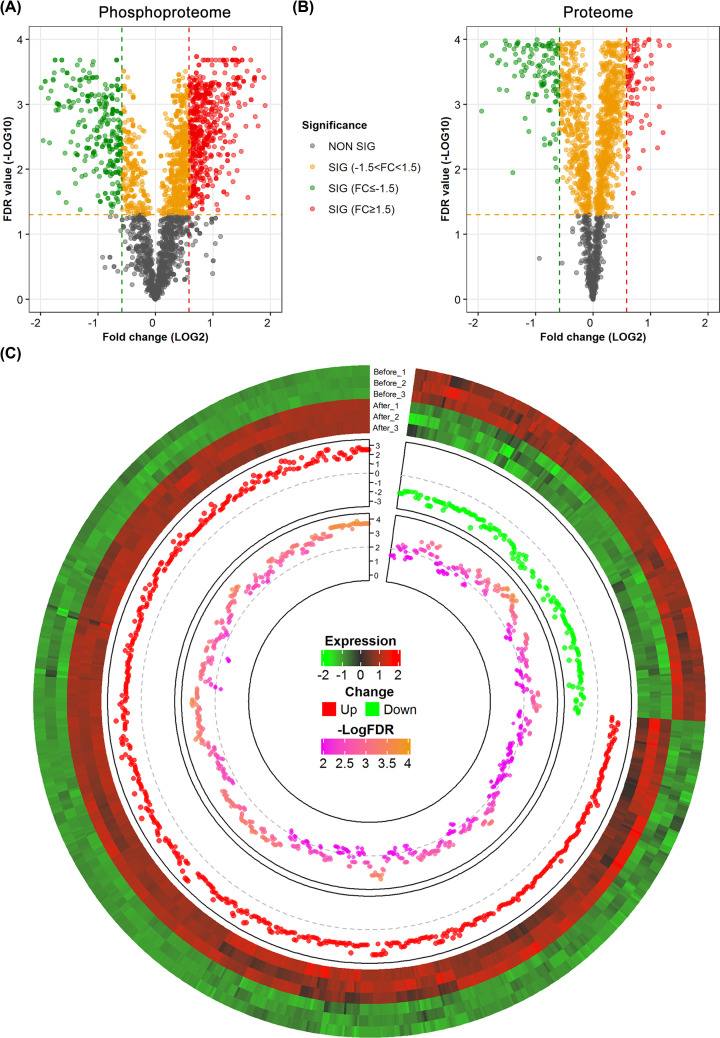
Figure 3. Expression analysis of the phosphoproteome and proteome.
(A) Volcano plot of the whole phosphoproteome. The x-axis represents fold change (log2 transformed), while the y-axis indicates the statistical significance (−log10 transformation of FDR values). (B) Volcano plot of the whole proteome. Each site of protein is classified according to its values of fold change and statistical significance. (C) Circular plot of the reliable list of DE sites. From outer to inner, the track represents expression clustering, fold change, and significance (log-transformed FDR), respectively.

