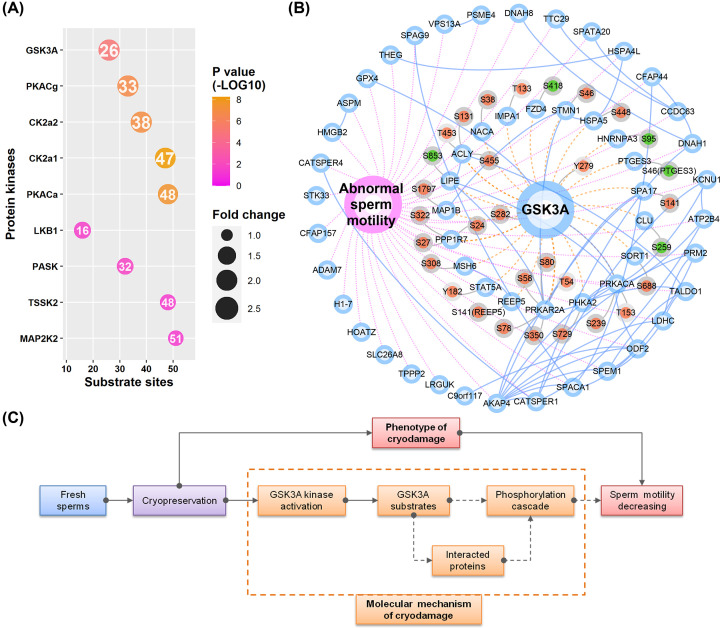
Figure 5. Kinase enrichment and GSK3A centric kinase–substrate network.
(A) The enriched list of kinases, sorted by fold change in reverse order. The scaled colors indicate the P-values (log-transformed). The size of the dot is proportional to fold change. Circles with purple, blue, and gray borders represent phenotype, proteins, and sites, respectively. Red and blue colors for the sites represent up-regulated and down-regulated expression, respectively. The number in the dot shows the count of substrate sites. (B) GSK3A centric kinase–substrate network. Blue solid lines, purple dashed lines, brown dashed lines, and gray solid lines indicate protein-to-protein interactions, gene-to-function relations, kinase–substrate relations, and protein–sites relations, respectively. (C) A schematic diagram for the connection between GSK3A kinase signaling and the decrease in sperm motility. Abbreviation: GSK3A, glycogen synthase kinase-3α.

