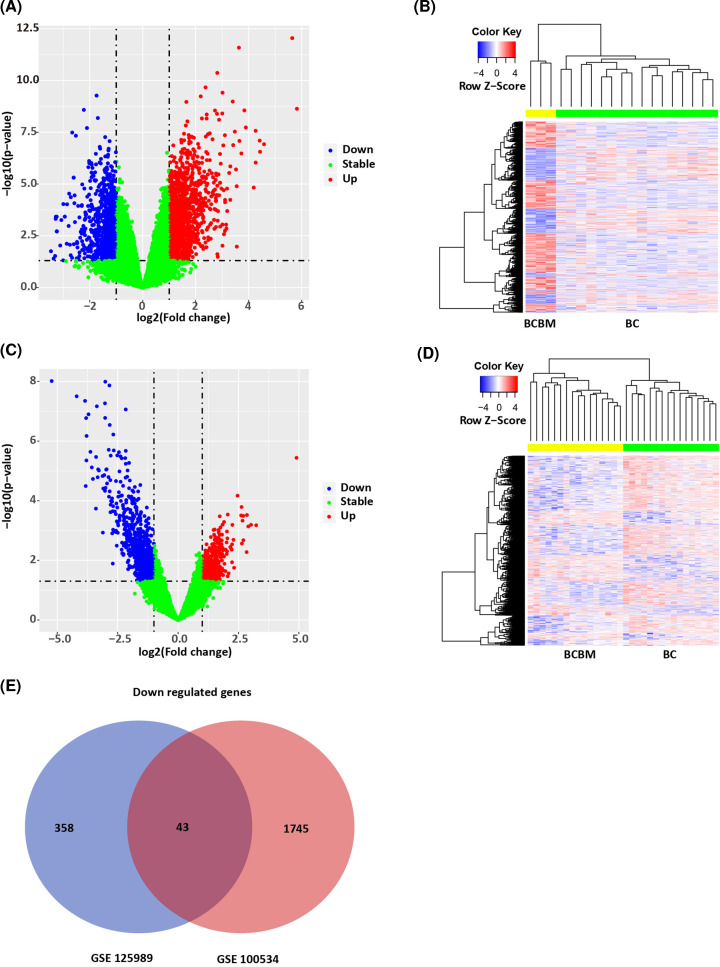
Figure 1. Identification of DEGs related to BCBM in BC patients.
(A) Volcano map of DEGs in GSE100534. X-axis: log2FC; Y-axis: −log10 (FDR). Blue: down-regulated genes; red: up-regulated genes; green: non-significant. (B) Heat map of DEGs in GSE100534. X-axis: sample; Y-axis: different genes. Red: high expression; blue: low expression. BCBM and BC samples could be obviously clustered into two clusters. (C) Volcano map of DEGs in GSE125989. X-axis: Log2FC; Y-axis: −log10 (FDR). Blue: down-regulated genes; red: up-regulated genes; green: non-significant. (D) Heat map of DEGs in GSE125989. X-axis: sample; Y-axis: different genes. Red: high expression; blue: low expression. BCBM and BC samples could be obviously clustered into two clusters. (E) Venn diagram of overlapped DEGs between GSE100534 and GSE125989.

