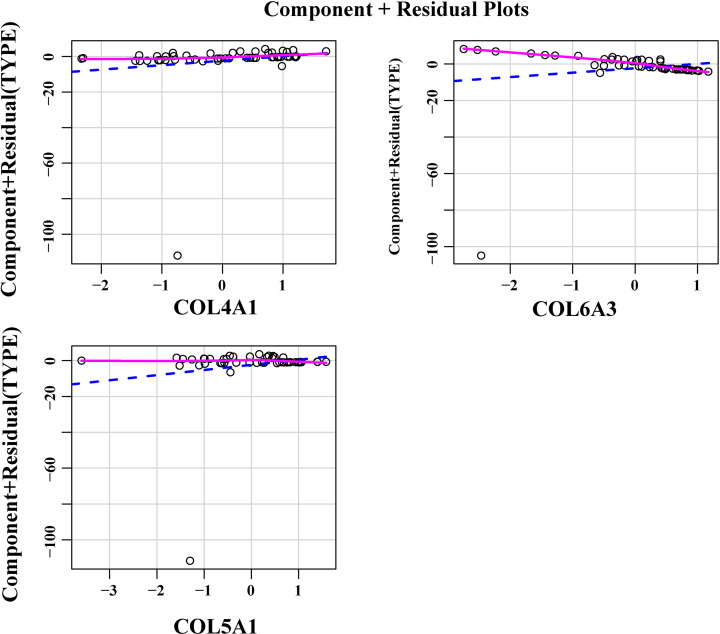
Figure 9. The component plus residual plot of the three genes included in the model.
A relatively obvious linear relationship between the horizontal axis and the vertical axis in the graph could be observed, which indicated that the independent variables were suitable for being included in the model.

