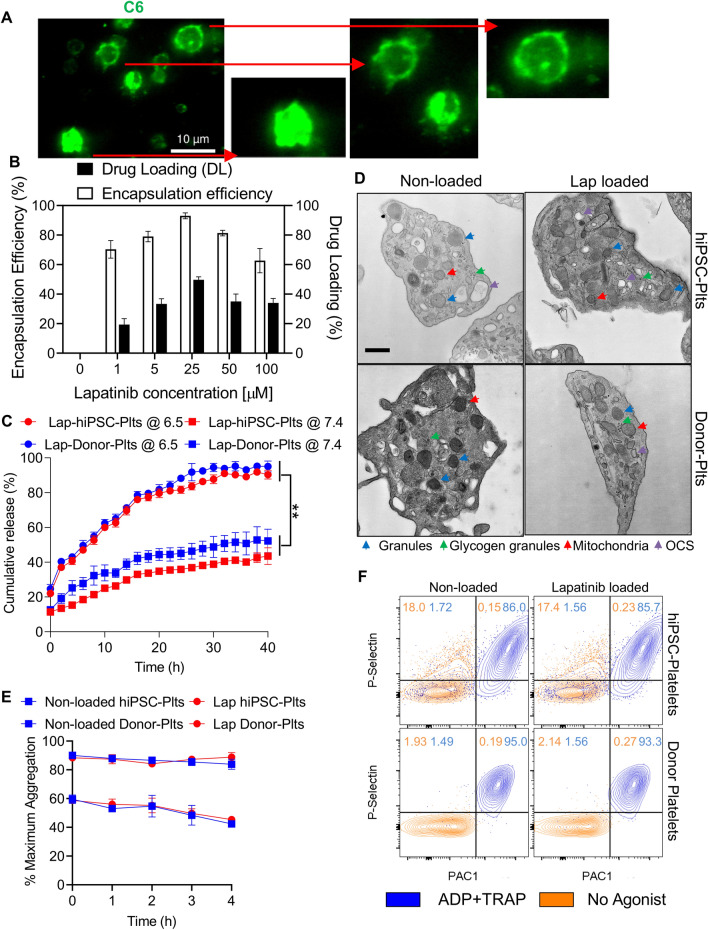
Figure 2.
Functionality characterization and comparison of lapatinib-loaded hiPSC-platelets to non-loaded hiPSC-platelets. (A) Fluorescence image of hiPSC-platelets under an oil immersion lens (×100), demonstrating the in vitro cellular uptake of fluorescent C6 (green). Scale bars = 10 µm. Inset zoomed in images of individual C6-loaded hiPSC-platelets are shown on the right. (B) Encapsulation efficiency and drug loading capability of lapatinib-loaded hiPSC-platelets with different concentrations of lapatinib (means ± SD, n = 3). ** indicates p < 0.01. (C) Analysis of lapatinib release kinetics from hiPSC- and donor-derived platelets in PBS at pH values of 6.5 and 7.4 at 37 °C over 40 h. (D) Transmission electron micrograph of non-loaded hiPSC and donor-derived platelets and platelets loaded with 25 µM lapatinib. Colored arrows indicate organelles: blue, granules; green, glycogen granules; red, mitochondria; and violet, OCS. Scale bar = 400 nm. (E) LTA-based aggregation assays of non-loaded and 25 µM lapatinib-loaded hiPSC- and donor-derived platelets stimulated with 20 µM ADP and 20 µM TRAP, showing time-dependent variability (mean ± SD, n = 3). (F) Representative flow cytometry (Fortessa) plots showing the surface PAC1 and P-Sel activation of non-loaded and 25 µM lapatinib-loaded hiPSC- and donor-derived platelets by 20 µM ADP and 20 µM TRAP. Orange contour plots represent unstimulated platelets, and blue contour plots represent platelets activated upon exposure to ADP and TRAP.

