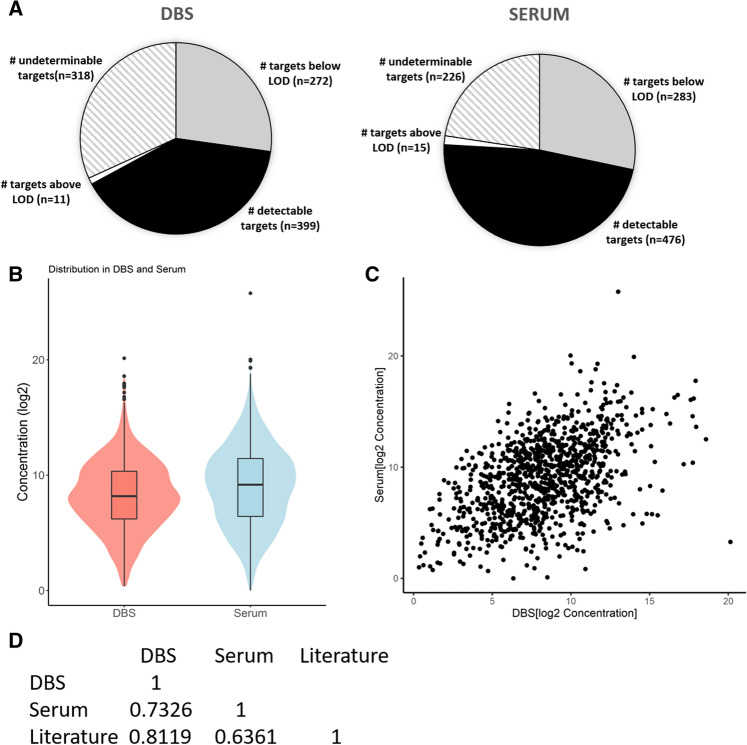
Figure 8.
Assessment of measurable proteins in normal DBS and serum samples in a quantitative multi-plex immunoassay. (A) Summary of the number of 1000 proteins that are below the LOD, within the detectable range, above the LOD, or that didn’t fall completely in either of the aforementioned categories in at least 2/3 of all samples assessed in DBS and serum, respectively. (B) Distribution of the concentration of measurable proteins in DBS and serum samples by violin plot. (C) Scatterplot of the distribution of the concentration of measurable proteins in DBS and serum samples. (D) Correlation of the 18 DBS and 28 Serum measurable FDA-approved protein biomarkers in at least 2/3 of the 72 DBS and 200 serum samples assessed with each other and reported serum literature values.

