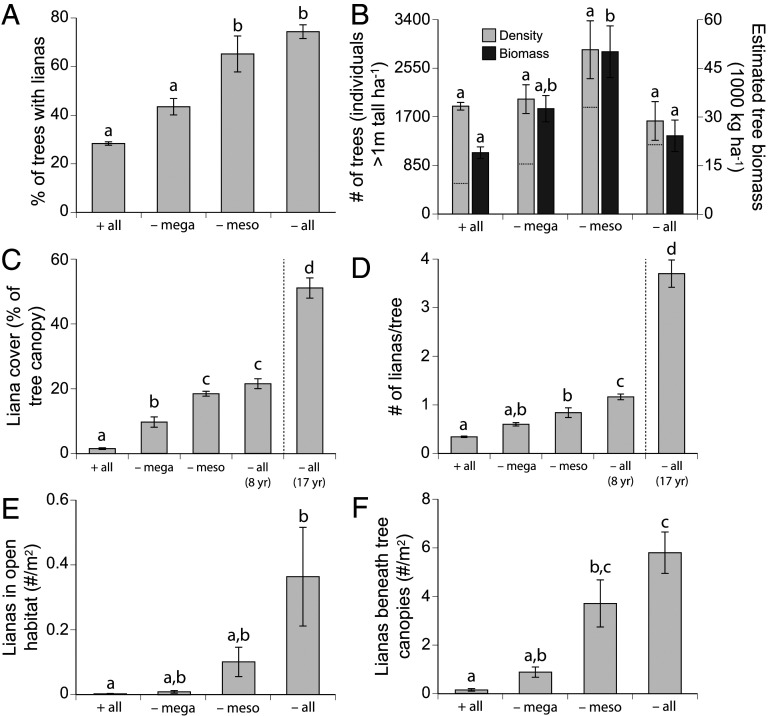
Fig. 2.
Responses of lianas and trees to experimental herbivory regimes. (A) Percentage of trees infested by C. viminale in each treatment (F3,8 = 23.22, P = 0.0003). (B) Light bars, Left y-axis: density of all trees >1-m tall (F3,8 = 2.67, P = 0.12); dotted lines show estimated mean number of liana-infested trees, inferred by multiplying the proportion of trees infested by tree density. Dark bars, Right y-axis: estimated biomass density of trees >1-m tall (F3,8 = 6.95, P = 0.013). (C) Percent cover of lianas on individual tree canopies (F4,9 = 333.96, P < 0.0001). (D) Number of individual lianas per tree (F4,9 = 139.70, P < 0.0001). Number of juvenile lianas rooted in (E) open habitat between tree canopies (F3,8 = 4.54, P = 0.039) and (F) beneath tree canopies (F3,8 = 15.92, P = 0.001). All data are from the UHURU experiment except for the 17-y −all treatment shown at right of the vertical dotted lines in C and D, which are from GLADE exclosures prior to fence removal. Data are plot-level means ±1 SEM (n = 3 plots per treatment in UHURU, 2 plots in GLADE). Statistical tests are from one-way ANOVA by treatment; letters denote significant differences between treatments in post hoc contrasts (Tukey’s HSD).

