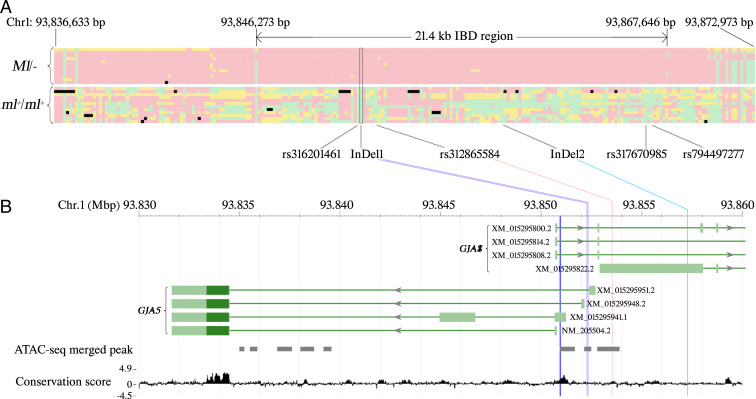
Fig. 3.
IBD mapping and identification of candidate mutations for Melanotic (Ml). Genomic positions refer to the GalGal6 assembly. (A) Haplotypes within and flanking the 21.4-kb IBD region identified by the WGS data of 12 samples from chickens carrying Ml (Upper) and 12 of 82 samples from chickens without Ml (Lower). Each cell represents the genotype of one polymorphism: green means homozygote of reference allele, red means homozygote of alternative allele, yellow means heterozygote, black means no call. Each row represents one sample. Each column represents one polymorphic site; the sites that are fixed for the reference allele in the top 12 samples are excluded. The six candidate mutations are indicated. (B) Localization of three candidate mutations, in relation to the GJA8 and GJA5 transcripts. Only the 5′ parts of the GJA8 transcripts are shown. Dark green bars represent coding regions while light green bars represent UTRs. The dark blue vertical line represents a predicted transcription start site of GJA5 (15). The gray solid boxes represent ATAC-seq merged peaks (11). The 77 vertebrates basewise PhyloP conservation scores (https://hgdownload.soe.ucsc.edu/goldenPath/galGal6/phastCons77way/) are shown at the bottom.

