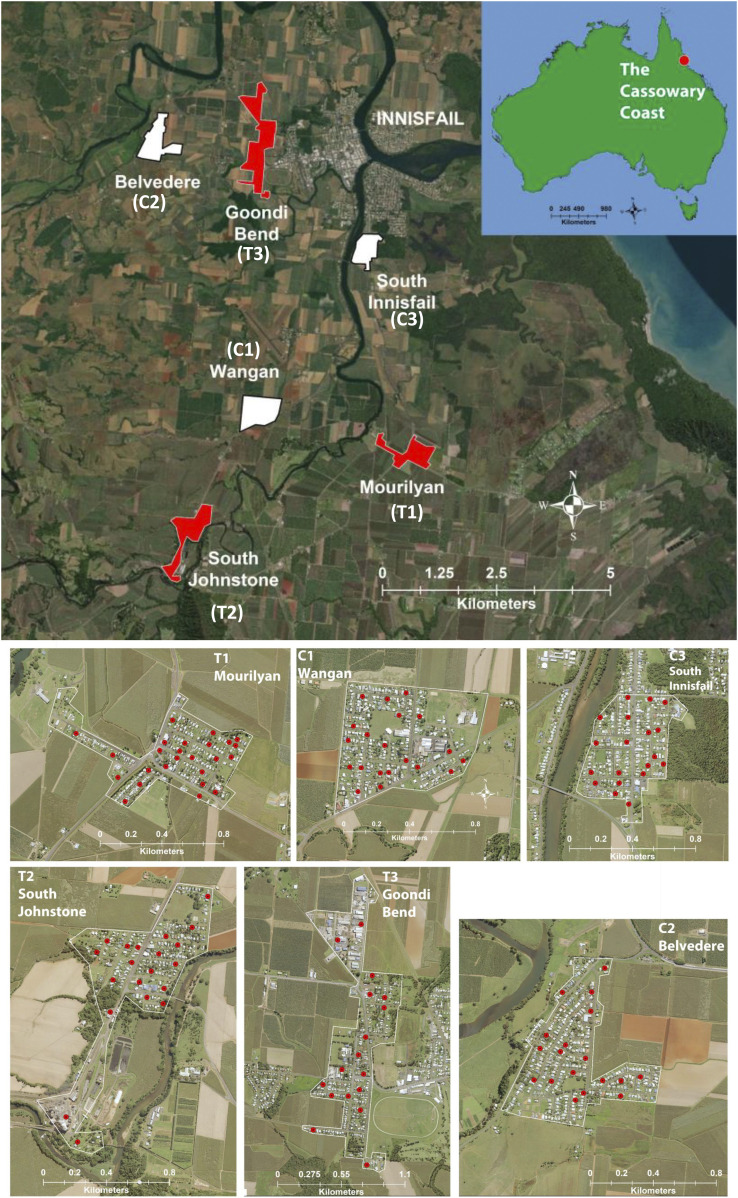
Fig. 1.
Field trial sites in the Northern Cassowary Coast region. Control landscapes are white, and treatment landscapes are red. Urban landscapes are isolated by extensive sugar cane, and banana plantations and the proximity of all landscapes to each other are show in the upper panel, with more-detailed images of the three treatment (T1 to T3) and the three control landscapes (C1 to C3) in the lower panel. Red dots indicate positions of paired BGS traps and ovitraps used for monitoring.

