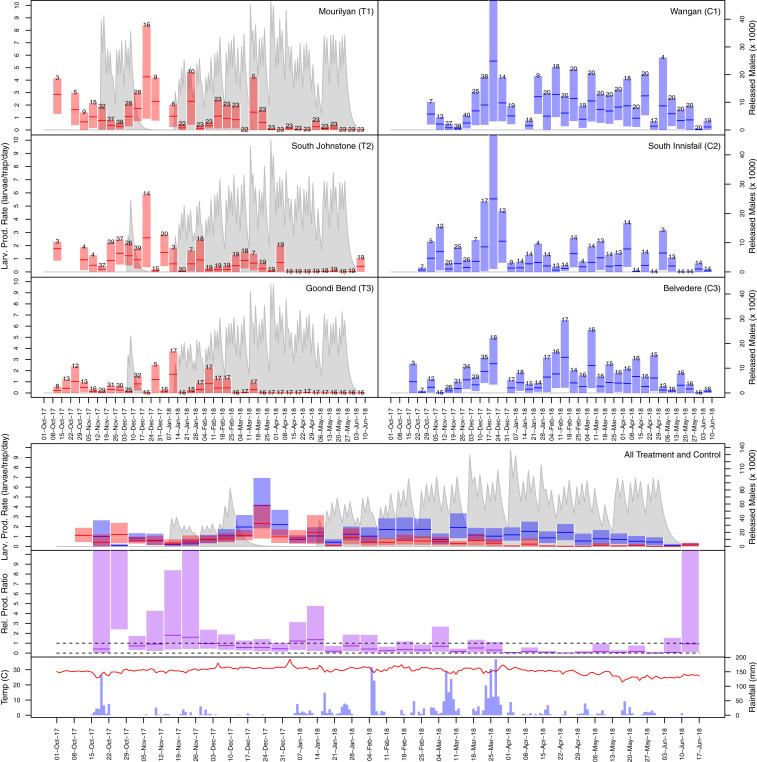
Fig. 4.
Larval productivity of Ae. aegypti in paired ovitraps. The upper panels show adult weekly mean larval productivity rate and bootstrapped 95% CIs, with treatments shown as red bars (T1 to T3) and controls shown in blue bars (C1 to C3). The numbers above the bars represent the number of measurements contributing to the trapping rate estimate. The gray lines show the expected number of living released wAlbB2-F4 males assuming 30% death rate per day. Test releases through November and December 2017 (11 into T1 and two into T2 to T3) were followed by a 5-wk hiatus, and then 55 releases over 20 wk (three per week) were sustained into T1 to T3 (January 12 to May 25). The lower panels show aggregated treatment and control plots for larval productivity (red T1 to T3 and blue C1 to C3). Ae. aegypti larval productivity is shown below that as relative trap ratio of treatments to controls in purple. The dashed lines delineate values of 1 and 0, between which the treatment landscapes are lower than in the controls (i.e., suppression). In the bottom panel, temperature is tracked by the red line with, rainfall shown as blue bars.

