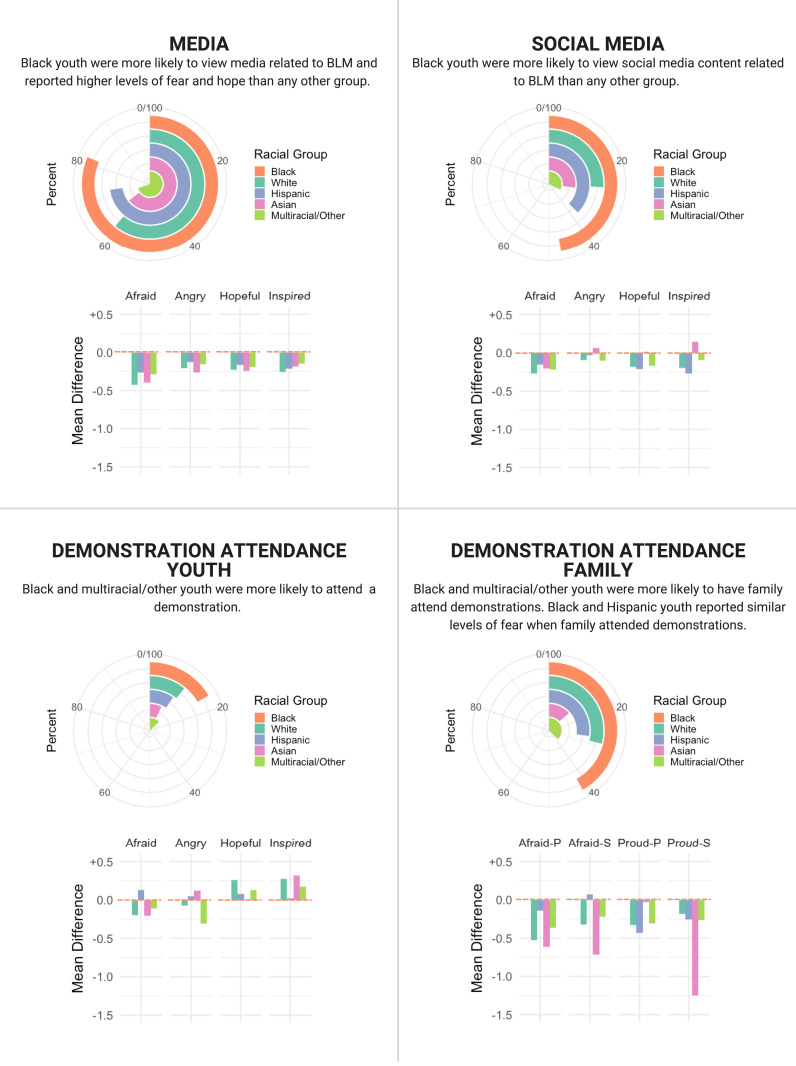
Fig. 1.
Stacked donut plots display the frequency of engagement with TV/radio/Internet media, social media, in-person demonstration (recoded as attend/not attend for visualization), and family demonstration attendance (recoded to combine parent and sibling for visualization). Bar charts display the difference between the mean feelings for Black adolescents and each racial/ethnic group for each mode of engagement (0.0 on the y axis [orange] represents the Black adolescent mean; positive values indicate Black adolescents report lower levels of positive or negative feelings; negative values represent Black adolescents report higher levels of positive or negative feelings).

