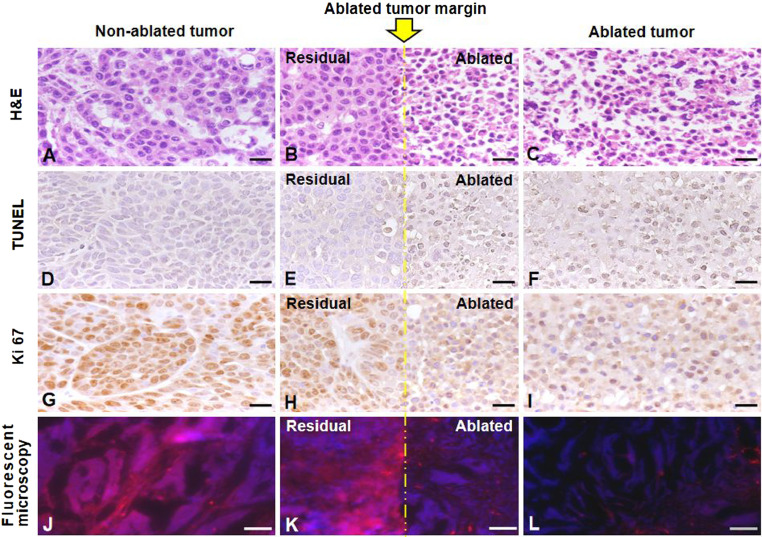
Fig. 10.
Pathology results with different staining. Yellow line indicates the ablated tumor margin. (A–C) H&E staining confirmed tumor formation (A), as well as the smudged cellular nucleus (C) after the lethal ablation. (D–F) Terminal deoxynucleotidyl transferase dUTP nick end labeling (TUNEL) staining demonstrated more dead cells (brown in E and F) in the ablated tumor. (G–I) Ki67 staining showed more cell proliferation (brown in G and H) in the residual (H) and the nonablated tumor (G). (J–L) Fluorescent microscopy more clearly demonstrated the residual and viable tumor cells (pink in J and K), as outlined by ICG, which further confirmed the sensitivity of ICG-based OI developed in this study, for differentiating the surviving (viable) tumors from dead (nonviable) tumors during an ablation procedure. [Scale bars (H&E, TUNEL, and Ki67), 20 μm; scale bar (Fluorescent microscopy), 50 μm.]

