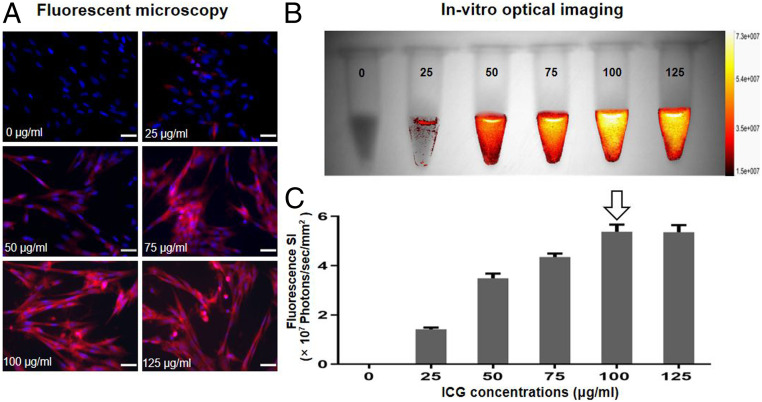
Fig. 2.
Optimization of ICG dose for in vitro OI of ICG-treated VX2 tumor cells (ICG cells). (A) Fluorescent microscopy images showed that the intracellular ICG fluorescence signal became more intense as ICG concentrations increased from 0 to 125 μg/mL. (B) The optical/X-ray images of ICG cells demonstrated an increase of fluorescence signal as ICG concentrations increased from 0 to 125 μg/mL. (C) Quantitative analysis of fluorescence SI further confirmed a similar SI between the concentrations of 100 and 125 μg/mL, which thus indicated the optimal concentration of 100 μg/mL (arrow) for ICG uptake by VX2 tumor cells. (Scale bars, 50 μm.)

