Fig. 1.
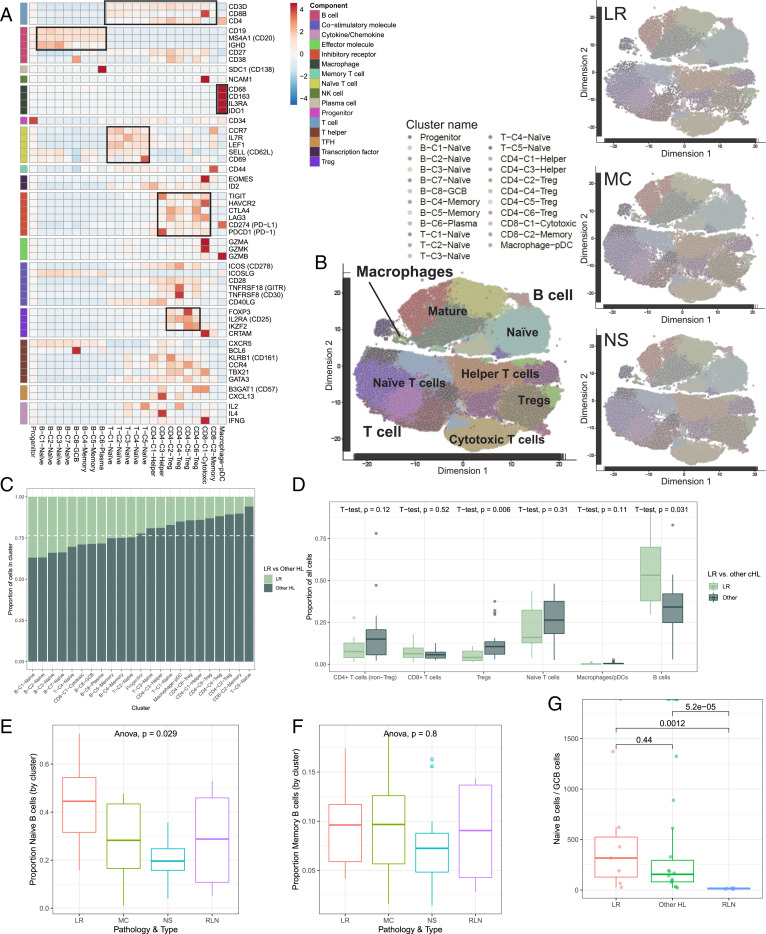
Immune cell atlas of the LR-CHL microenvironment at single-cell resolution. Cells from 28 CHL and 5 RLN cases were clustered using the PhenoGraph algorithm to identify groups of cells with similar expression patterns. (A) Heatmap summarizing mean expression (normalized and log transformed) of selected canonical markers in each cluster. Data have been scaled row-wise for visualization. The covariate bar on the Left side indicates the component associated with each gene, and black boxes highlight prominent expression of known subtype genes. (B) Single-cell expression of all cells from CHL and RLN in tSNE space (first two dimensions). Cells are colored according to PhenoGraph cluster. Subsets of cells from each CHL subtype are shown on the same coordinates. (C) Proportion of cells in each cluster originating from LR-CHL (light green) and other CHL (dark green) samples. The dashed white line represents the total proportion of cells from other CHL samples in the merged population. (D) The proportion of cells assigned to a given immune cell type (as determined by cluster annotation) was calculated for each sample. Boxplots summarize the distribution of the proportions for all samples, grouped by pathological subtype (LR-CHL or other CHL subtype). P values are shown Above and demonstrate a significant increase in the proportion of B cells present in LR-CHL compared to other CHL. (E and F) Boxplots summarizing the proportion of naïve (E) and memory (F) B cells relative to total cells in each sample, separated according to CHL subtype and RLNs. (G) Ratio of naïve B cells/germinal center B cells (by cluster assignment) according to pathological subtype. P values were calculated using t tests.

