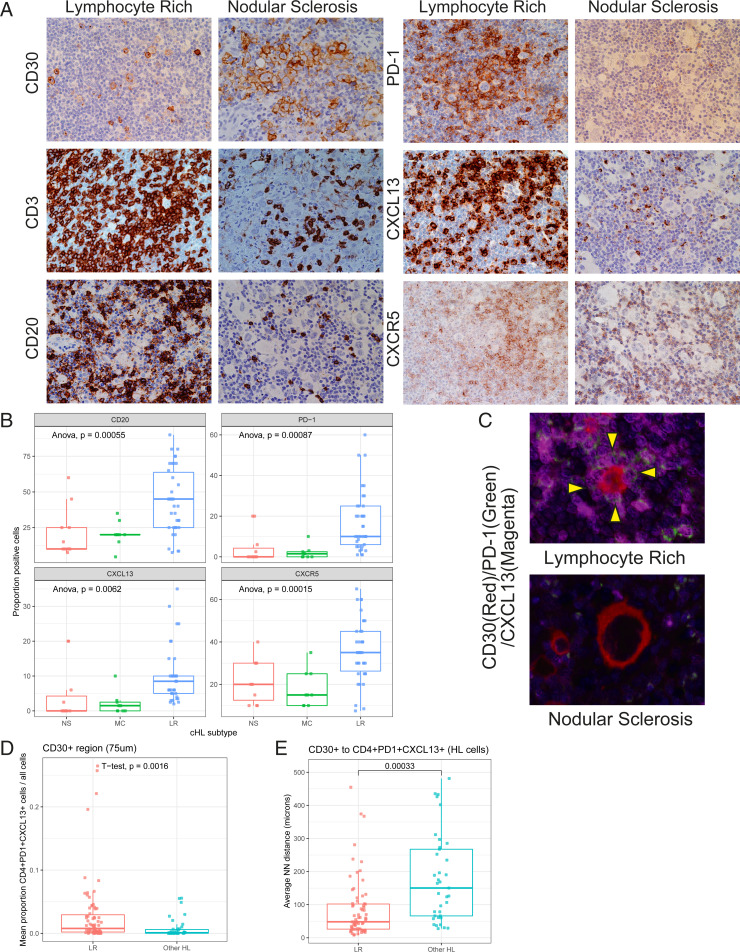
Fig. 3.
Spatial distribution of HRS cells and CXCL13+ T cells in LR-CHL. (A) IHC staining for major immune cell markers in representative cases with either LR-CHL (Left; LRCHL20) or nodular sclerosis CHL (Right; CHL03) (×400). (B) Boxplot showing proportions of positive cells by IHC for major immune cell markers according to disease subtype. P values were calculated using Anova tests. (C) Multicolor IF staining (CHL05 and LRCHL16) for CD30 (red), PD-1 (green), and CXCL13 (magenta) shows localization of CD4+PD-1+CXCL13+ T cells in rosettes around HRS cells in cases with LR-CHL. No rosettes are observed in cases of other CHL subtypes (e.g., nodular sclerosis shown here). (D) Boxplot showing the proportion of CD4+PD-1+CXCL13+ T cells in the region surrounding CD30+ cells (HRS) for each sample, separated by CHL subtype. The surrounding region was defined by a distance of 75 μm. (E) Average nearest neighbor (NN) distance from an HRS cell (defined by CD30+) to its closest CD4+PD-1+CXCL13+ cell was calculated per sample and plotted by pathological subtype. P values were calculated using t tests.

