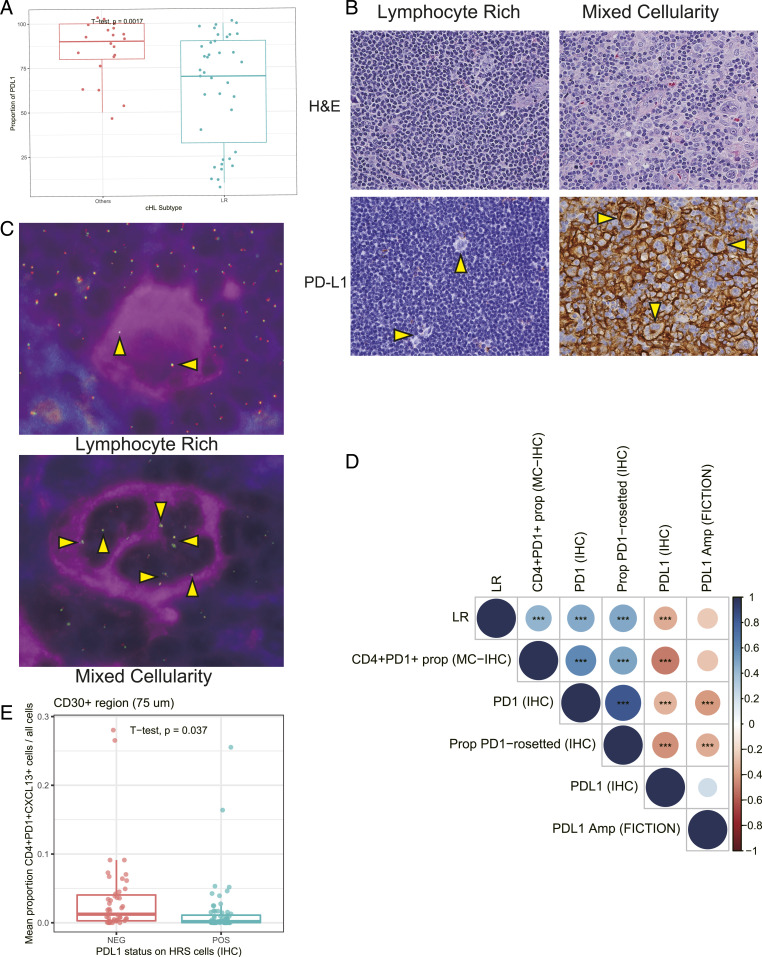
Fig. 5.
PD-L1 genomic alterations in HRS cells in LR-CHL. (A) Boxplot summarizing the proportion of PD-L1+ HRS cells by IHC in each sample, separated according to CHL subtype. (B) IHC staining for PD-L1 in representative CHL cases (×400; CHL20 and CHL25). (C) Combined immunofluorescence for CD30 (magenta) and fluorescence in situ hybridization (FISH) using bacterial artificial chromosome probes in the PD-L1 and PD-L2 region (green and red signals) shows PD-L1/L2 amplification in HRS cells in mixed cellularity CHL (Lower) (×400; CHL20) but not in lymphocyte-rich CHL (Upper) (×400; LRCHL01). Of 26 LR-CHL cases, 5 (19%) cases showed PD-L1/L2 amplification in HRS cells. (D) Dotplot showing correlation of PD-L1 alteration status in HRS cells with expression level of major immune cell markers (IHC). Dot size and color summarize Pearson correlation values, with positive correlations represented in blue and negative correlations represented in red. Asterisks represent associated P values (***P < 0.001). (E) Boxplot showing the proportion of CD4+PD-1+CXCL13+ T cells in the region surrounding CD30+ cells (HRS) for each sample, separated by PD-L1 expression status on HRS cells (IHC). Of the 58 CHL samples, 34 cases (59%) showed high PD-L1 expression on HRS cells. The surrounding region was defined by a distance of 75 μm.

