Fig. 5.
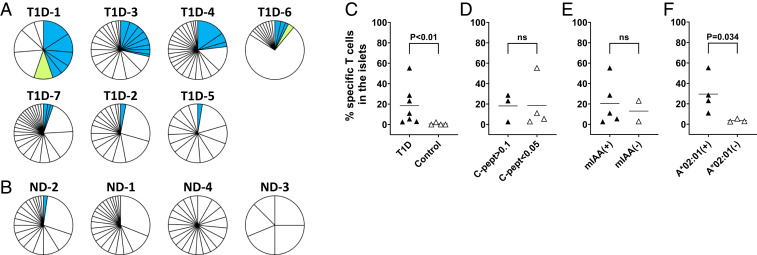
Frequency of preproinsulin and insulin DRiP–reactive CD8 T cells. (A and B) Individual pie-charts indicate frequencies of CD8 T cells responding to preproinsulin (blue) and insulin DRiP (lime) peptides in CD8 T cells represented more than once in the islets of each donor. T cells expressing TCR clonotypes for which preproinsulin and insulin DRiP reactivity screening was performed were included in analysis. Each slice represents T cells expressing an identical unique TCR clonotypes. Panels A and B contain T1D and nondiabetic control donors, respectively. (C–F) Individual symbols represent frequencies of preproinsulin and insulin DRiP–reactive CD8 T cells among CD8 T cells studied for response to preproinsulin and insulin DRiP. Statistical significances for frequencies of preproinsulin and insulin DRiP–reactive CD8 T cells by donors with and without T1D (C), levels of C-peptide (D), the presence of insulin autoantibodies (E), and donors with and without HLA-A*02:01 (F) were assessed by the Mann–Whitney U test.

