Fig. 4.
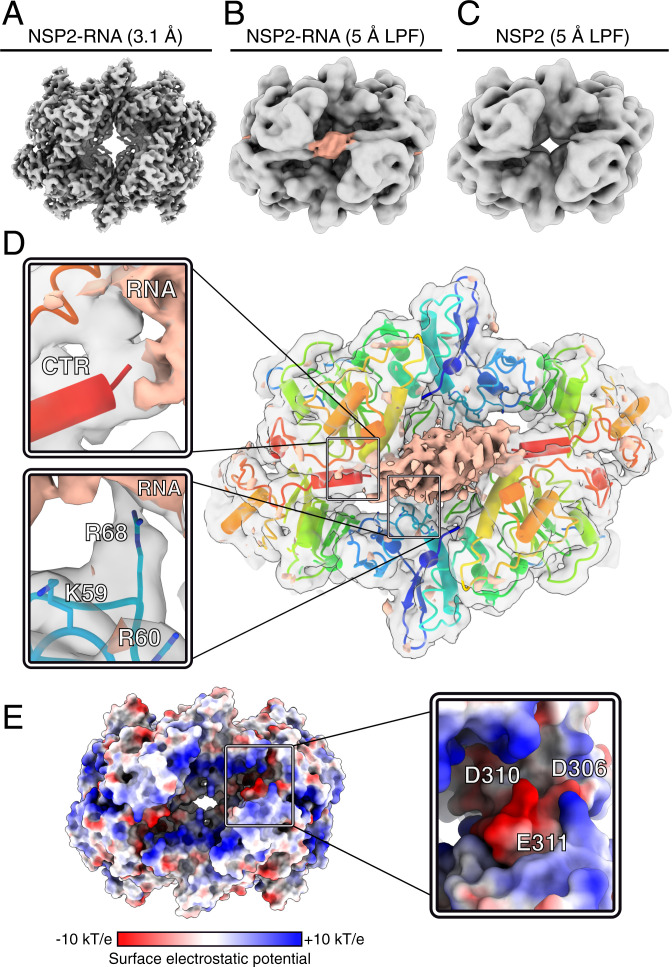
Cryo-EM structure of the NSP2–RNP complex. (A) A 3.1-Å-resolution reconstruction of the NSP2–RNP complex. (B and C) Cryo-EM maps of NSP2–RNA (B) and NSP2 apoprotein (C) LPF to 5 Å. A cryo-EM density feature (peach) is attributed to bound RNA in the LPF RNP map. Both maps are reconstructed with D4 symmetry. (D) Direct visualization of interactions between NSP2 and RNA using C4 symmetry expansion and focused classification. The positive difference density map corresponding to RNA (peach) is overlaid onto the unsharpened NSP2–RNP complex map determined through symmetry expansion and focused classification (gray, transparent density) and atomic model of NSP2. (Inset) Zoom-in of the CTR positioned relative to RNA density (Top) and RNA-interacting residues (Bottom). (E) The surface electrostatic potential analysis of NSP2. (Inset) Zoom-in of the CTR, with residues within the acidic patch (D306, D310, and E311) annotated.

