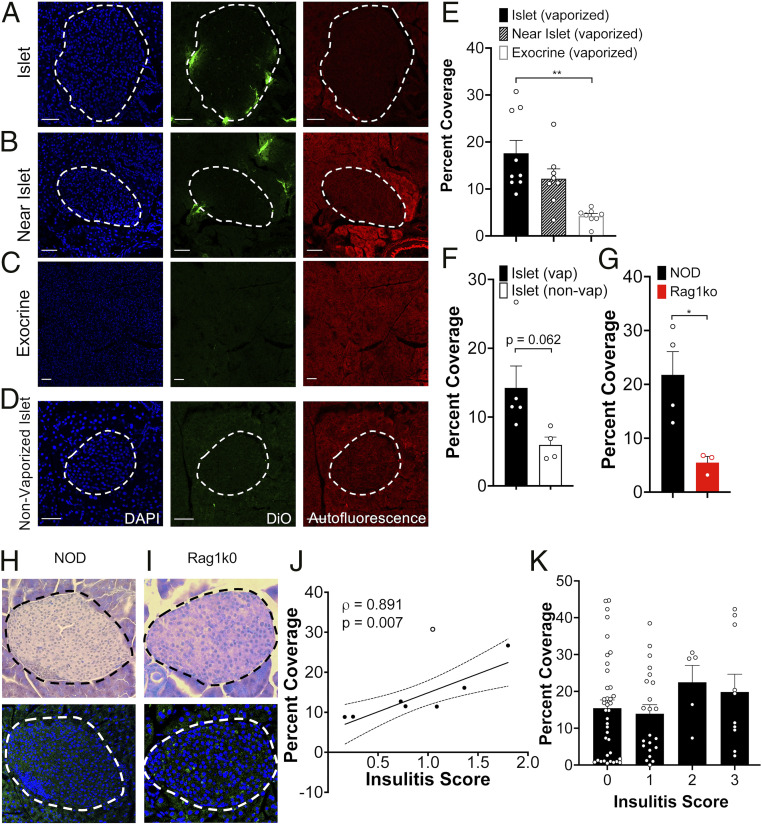
Fig. 4.
Histological assessment of ND accumulation within the islets in T1D. (A) Representative confocal images of an islet within a pancreas section of 10-wk-old female NOD mouse following DiO-labeled ND infusion (green). Islet is circled with a dotted line, as determined from autofluorescence (red) and DAPI-labeling morphology (blue). (B) As in A for “near islet” (<200 μm from the islet) regions within the pancreas. (C) As in A for exocrine region far (>500 μm from the islet). (D) As in A but for female 10-wk-old NOD mice that did not receive ultrasound scans and therefore had no ND vaporization. (E) Mean DiO coverage in the islet, near islet regions, and exocrine tissue in 10-wk-old female NOD mice where NDs were vaporized. (F) Mean DiO coverage in the islet from 10-wk-old female NOD mice in which NDs were vaporized or nonvaporized. (G) Mean DiO coverage in the islet from 10-wk-old female NOD mice and 10-wk-old female Rag1ko mice. (H) Representative image of H&E-stained pancreas sections of 10-wk-old NOD mice, together with DiO fluorescence in neighboring tissue section. (I) As in H for pancreas sections of 10-wk-old NOD;Rag1ko mouse. (J) Scatterplot of the mean DiO fluorescent coverage of islets within the pancreas versus the mean insulitis score within the pancreas for NOD mice. (K) Mean DiO fluorescent coverage of islets within the pancreas that show insulitis scores of 0, 1, 2, or 3 (see Materials and Methods). Error bars in E, F, G, and K represent SEM. Trend line in J indicates linear regression with 95% CIs. Empty data point in indicates outlier. Outlier analysis used the Cook's distance: mean distance all points = 0.0808; outlier = 0.3803 (>3 times mean Cook’s distance). Data in E represents n = 8 mice (142 islets and 27 exocrine regions). Data in F (Vaporized) represents n = 5 mice (89 islets) and (nonvaporized) represents n = 4 mice (37 islets). Data in G (NOD) represents n = 4 mice (53 islets) and (Rag1ko) represents n = 3 mice (31 islets). Data in J represents n = 8 NOD mice (112 islets). Data in K represents n = 8 NOD mice (75 islets). (Scale bar, 50 μm in A through D.) The P value in E is 0.0024 (**P < 0.01) and in G is 0.0255 (*P < 0.05), comparing groups indicated (unpaired Student’s t test for data in E, F, and G; ANOVA for data in K). A mixed-effects model was used to assess the statistical significance and generate the regression in J.

