
Figure 3.
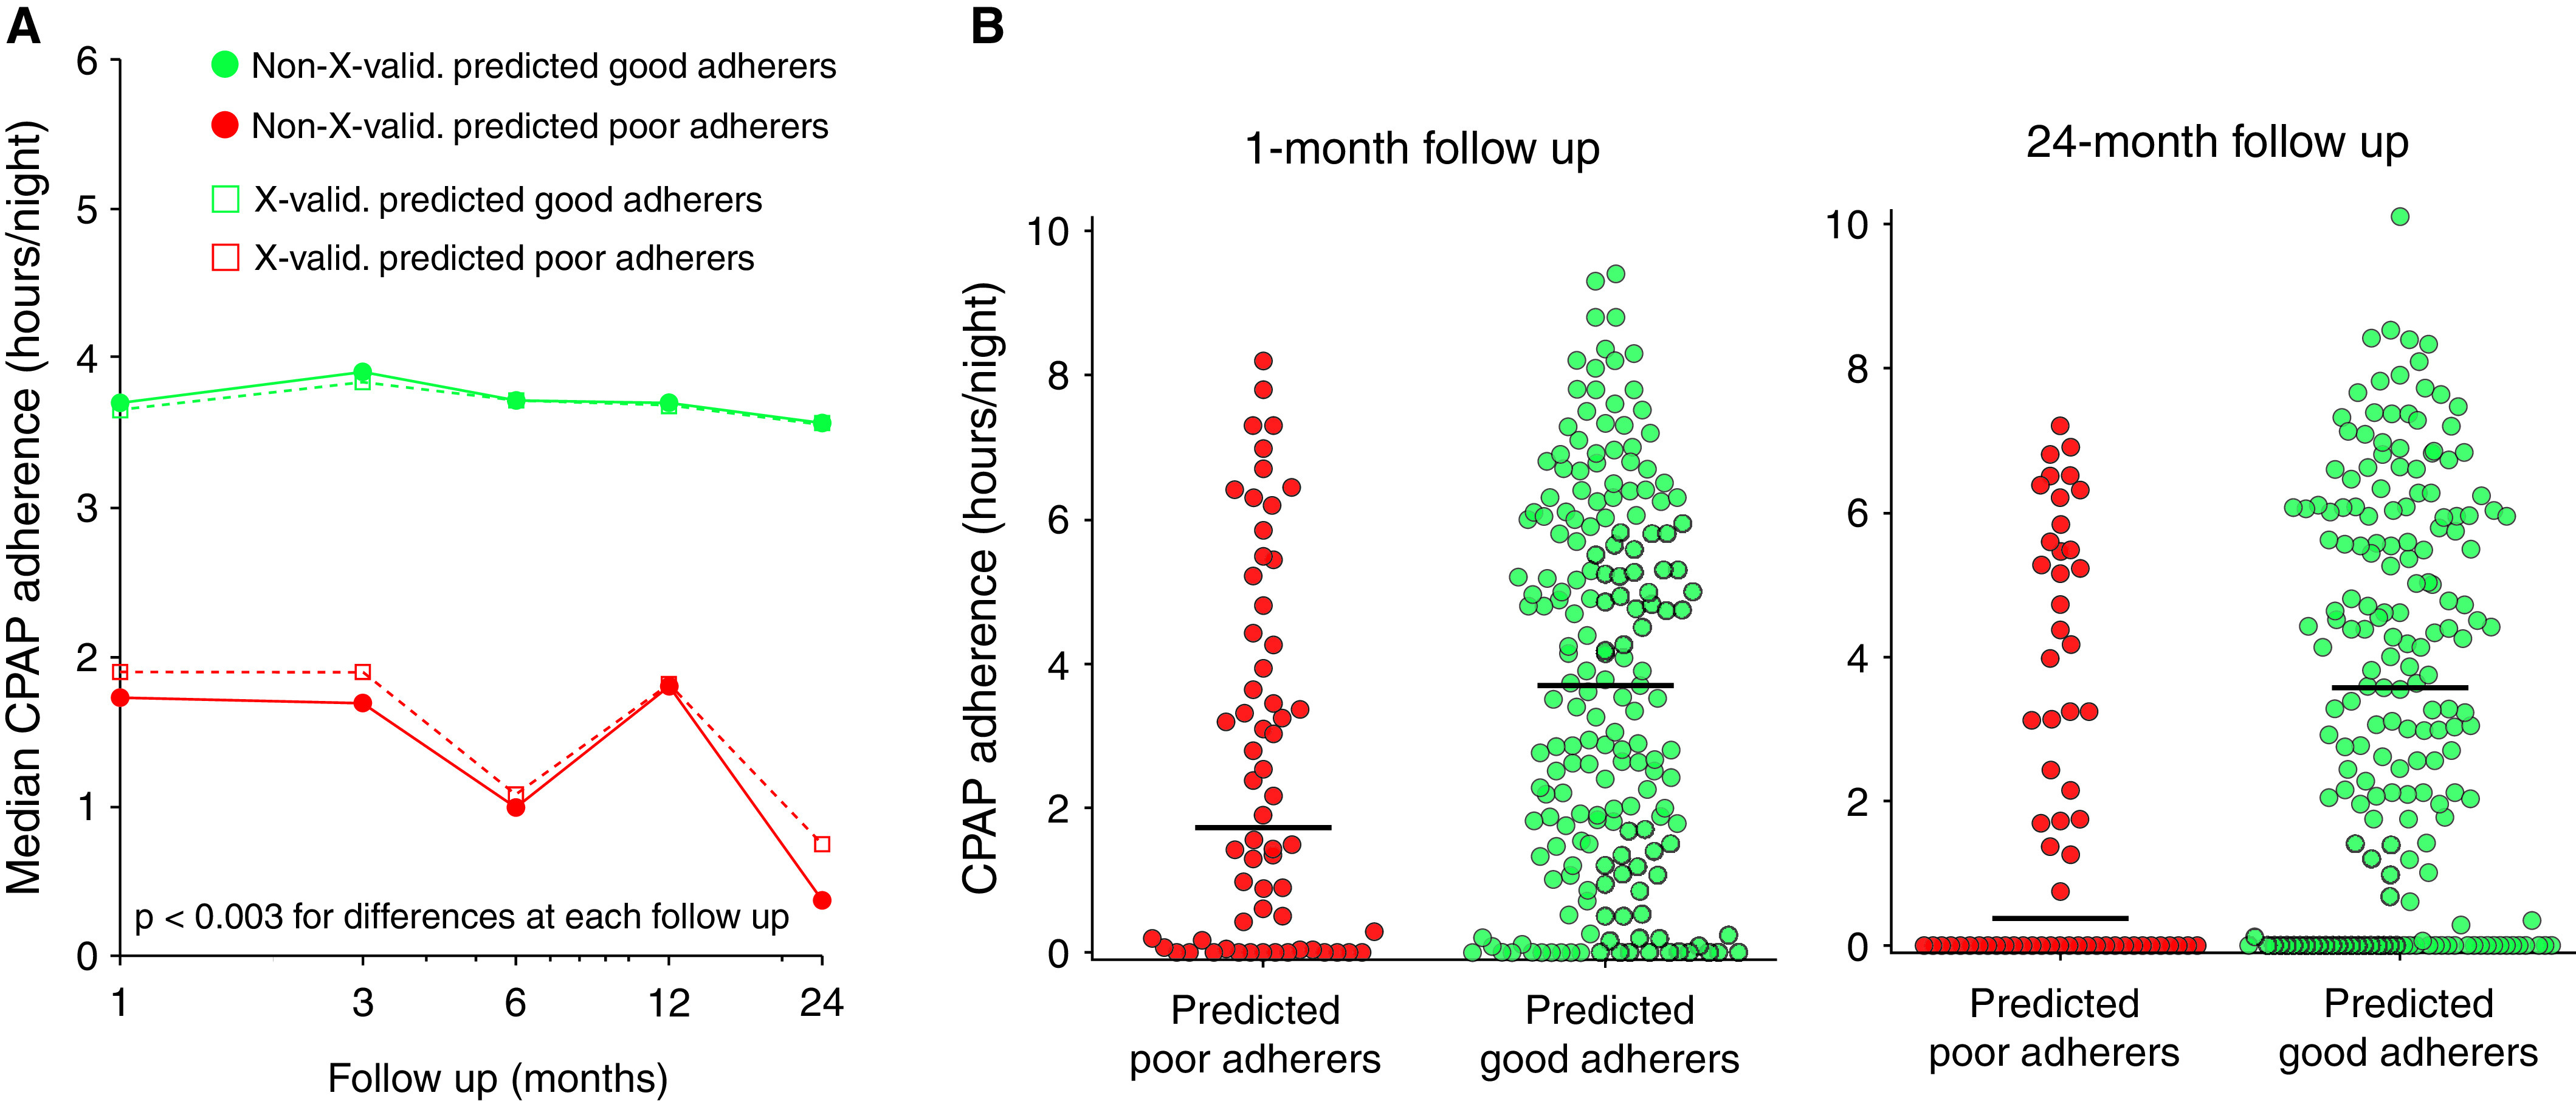
Comparison of continuous positive airway pressure (CPAP) adherence in those with predicted “good” adherence and those with predicted “poor” adherence. (A) Comparison made by using the physiological adherence model between the median actual CPAP adherence (h/night) of those with predicted good adherence (green) and the median actual CPAP adherence (h/night) of those with predicted poor adherence (red). Solid circles represent results before leave-one-out cross-validation, and open squares represent results after leave-one-out cross-validation. Differences between groups are statistically different across each time point (P < 0.003). (B) Distributions and medians (bars) of actual CPAP adherence among those with predicted good adherence (green, n = 187) and those with predicted poor adherence (red, n = 62) at the 1-month follow-up (change in median, 2.0 h/night; P = 0.003) and 24-month follow-up (change in median, 3.2 h/night; P < 0.001).