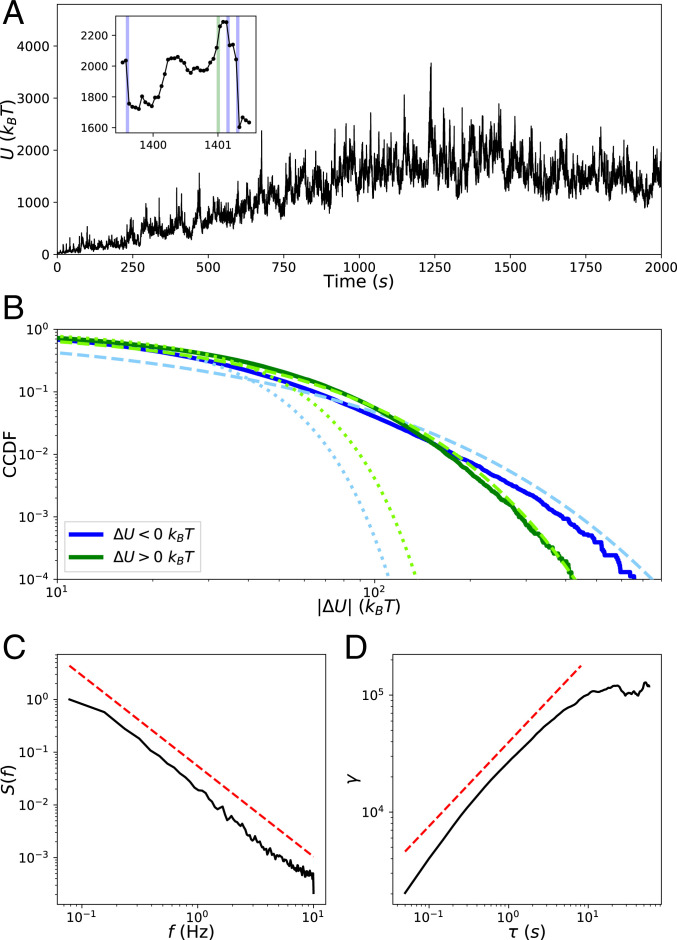
Fig. 2.
Statistics of . (A) Trajectory of the network’s mechanical energy for condition (Materials and Methods). (A, Inset) A blow-up of the trajectory to show instances of rare events of energy release (; blue) and accumulation (; green). (B) CCDFs of (blue) and (green) collected from five runs when the system is at QSS after 1,000 . Dotted lines in lighter colors represent fits to the data of a half-normal CCDF, and dashed lines represent fits of stretched exponentials. (C) The normalized power spectral density of for a single run at QSS from which the spectral exponent is determined by fitting a power law, shown offset in red. (D) The semivariogram obeys the scaling relationship over the scaling range.

