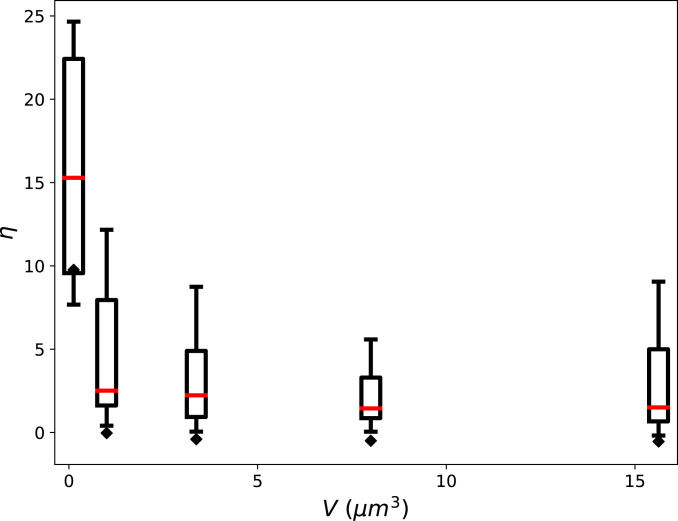
Fig. 6.
Plots for different simulation volumes of the distributions of non-Gaussian parameter of the distributions of individual filament displacements. The box and whisker plots summarize the distribution of for all filaments in the system, with the median shown as a red bar, the box extending from the first to the third quartiles, and the whiskers extending across the range of , omitting outliers. The black diamonds indicate the value of obtained when instead of tracking each filament’s displacement individually, the total summed displacement of all filaments from time point to time point is tracked. These global measurements of displacement are more Gaussian (with ) than the corresponding local measurements obtained from tracking filaments individually.

