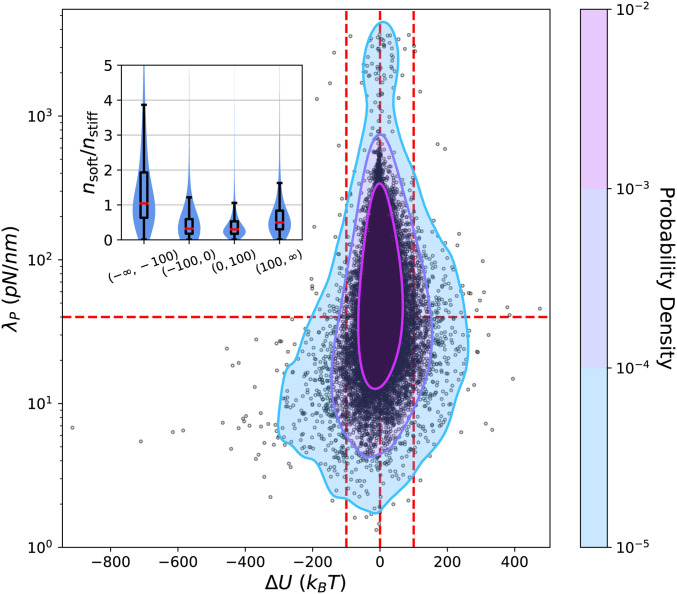
Fig. 8.
Scatter plot of the pairs , measured during QSS for a run of condition . From these points, a Gaussian kernel density estimate of the joint PDF (treating on a log-scale) is constructed and shown as a contour plot. Red guidelines demarcate regions of interest. (Inset) Combination violin and box-and-whisker plots showing the ratio for different categories of simulation cycles; c.f. Fig. 3. Inset is not blocking any of the scatter-plot data.

