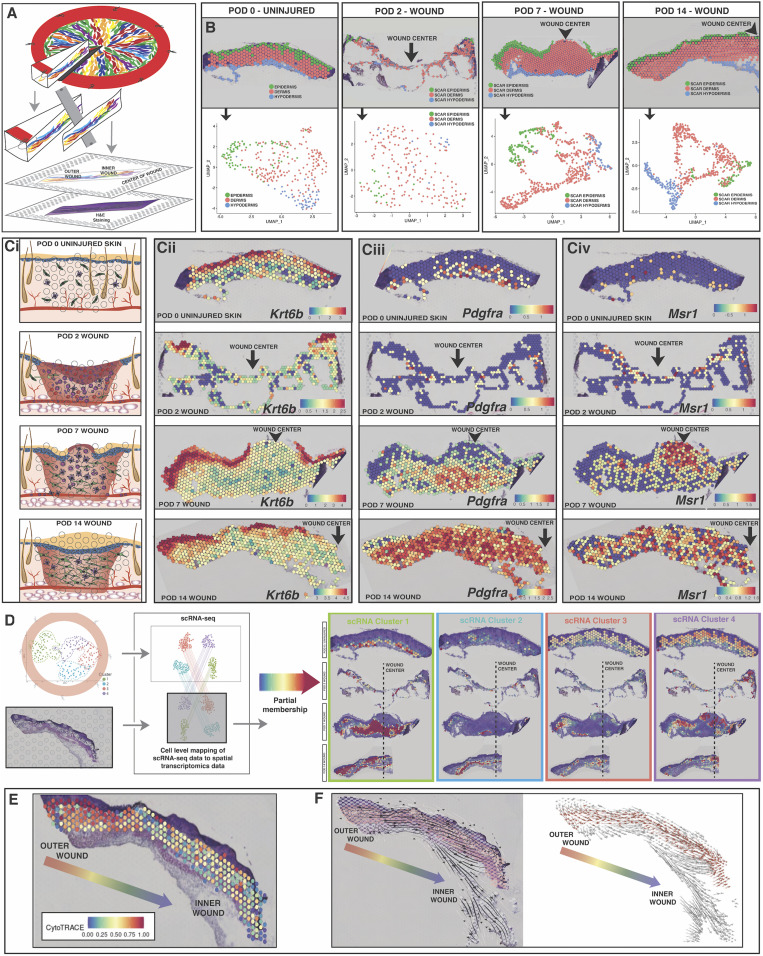
Fig. 4.
Spatial transcriptomics applied to wound healing and tracking of fibroblast subpopulations over time and space. (A) Schematic for generating spatial transcriptomics data from splinted excisional wounds using the 10× Genomics Visium protocol. Fresh Rainbow mouse wound tissue was harvested, flash frozen, embedded in optimal cutting temperature (OCT), and then sections were taken representing the complete wound radius. H&E staining and tissue section imaging were completed as described in the Visium protocol (SI Appendix, Methods). Each spot captures mRNA from 1 to 10 individual cells at that tissue location. (B) Delineation of scar layers based on underlying tissue histology at each timepoint (Top row), and UMAP plot showing that the three scar layers can easily be distinguished by their transcriptional programs, even independent of spatial information. (C) (i) Schematic of classic stages of wound healing evaluated at POD 2, 7, and 14 relative to uninjured skin. (ii) Keratinocyte activity as measured through expression of the Krt6b gene. (iii) Fibroblast activity as measured through expression of the Pdgfra gene. (iv) Immune cell activity as measured through expression of the Msr1 gene. (D) Anchor-based integration of scRNA-seq populations (defined in Fig. 2B) with Visium gene expression to project partial membership within each spot across all timepoints. These populations exhibit strong spatial preferences within the wound.

