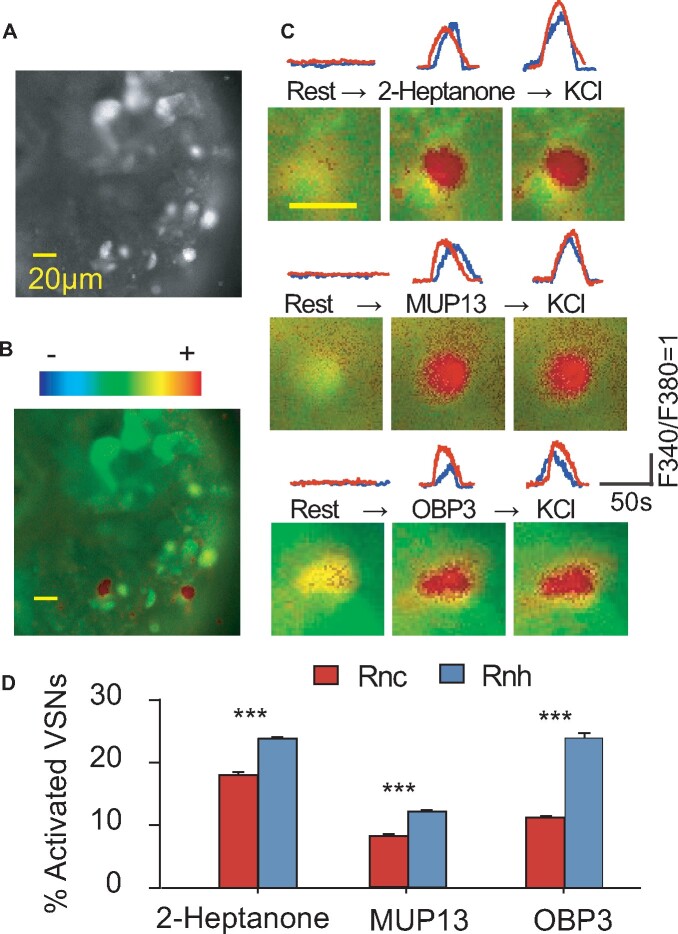
Figure 5.
Pheromones that evoked intracellular Ca2+ elevation in vomeronasal sensory neurons (VRNs). The fluorescence images are displayed on gray (A) and pseudocolor scales (B). (C) Traces and images of VRNs responsive to 10−5 M 2-heptanone, 10−7 M MUP13, 10−7 M OBP3, and 50 mM KCl (positive control). (D) Comparisons of the percentage of pheromone-activated cells between Rnc and Rnh rats (independent t-test, n = 4 for each subspecies, ***P < 0.001). The scale bar in the images represents 20 µm.

