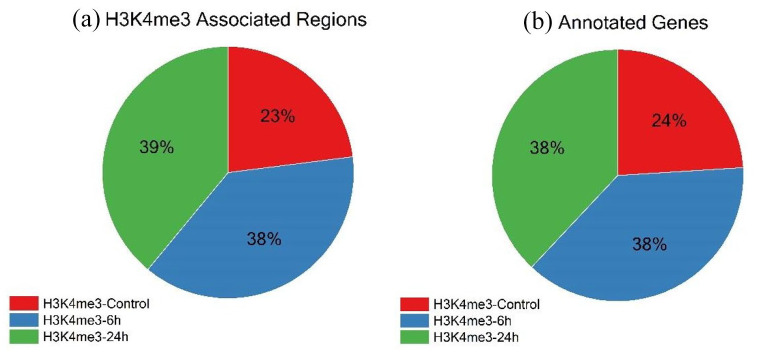
Figure 1.
Peaks obtained from MACS2 callpeak function were identified using the ChIPseeker R/Bioconductor package. The total number of peaks across all samples was taken as 100%. (a) Pie-Chart distribution of the number of regions that are associated with H3K4me3 modification in Control-0h (H3K4me3-Control), 6 hours (H3K4me3-6h) and 24 hours (H3K4me3-24h) induction of TGFβ1. (b) Pie-Chart distribution of Annotated genes obtained after removal of Pseudogenes and unidentified transcripts from total regions associated with H3K4me3.

