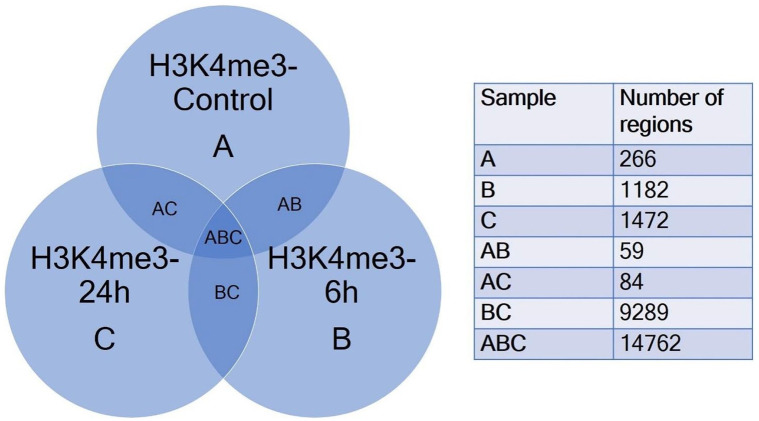
Figure 2.
Venn diagram of comparison of 3 gene lists – H3K4me3-Control-A, H3K4me3-6h-B and H3K4me3-24h-C obtained by annotation of MACS2 peaks using ChIPseeker package. The comparative list was constructed by identifying common and unique genes using conditional formatting in MS Excel for visualization of common regions and unique regions with respect to each sample dataset.

