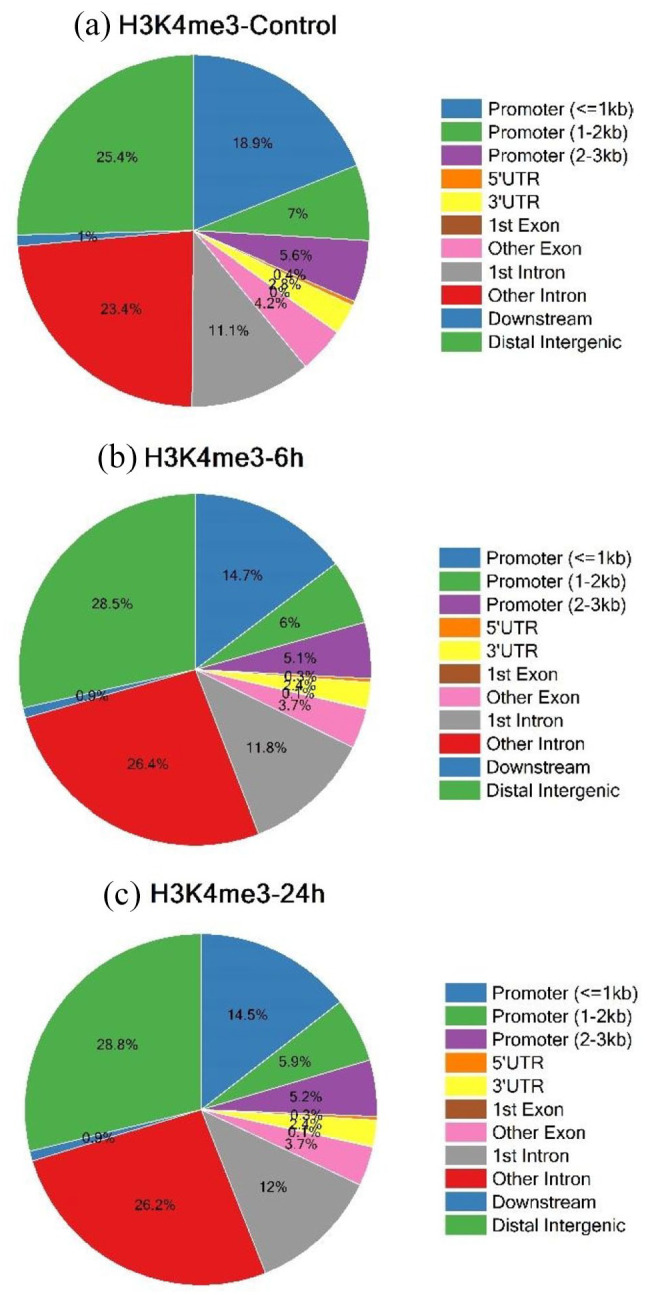
Figure 3.

Visualization of Genomic annotations using annotatePeak function of ChIPseeker R/Bioconductor package of H3K4me3 occupied regions with 0 hours (H3K4me3-Control) (a), 6h-H3K4me3-6h (b) and 24h-H3K4me3-24h (c) of TGFβ induction. The categories used were Promoter(⩽1 kb), Promoter (1-2 kb), Promoter (2-3 kb), 5′UTR, 3′UTR, first exon, other exons, first intron, other introns, downstream (⩽300), and distal intergenic.
