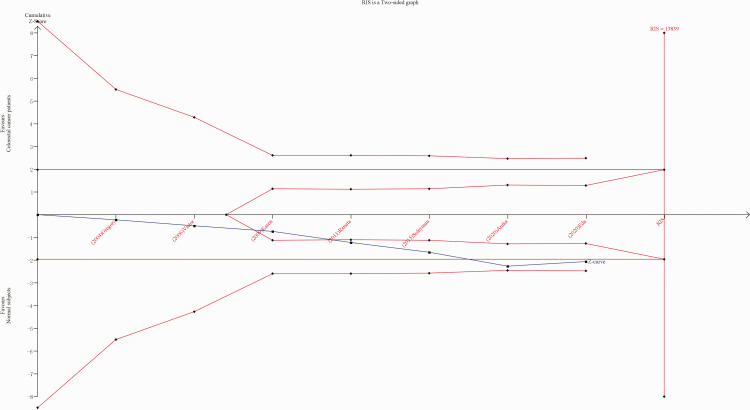
Figure 5.
Trial sequential analysis (TSA) of associations between the X-ray repair cross-complementing 2 (XRCC2) gene Arg188His polymorphism and the risk of colorectal cancer for histidine versus arginine. Red broken line, TSA boundary value; blue broken line, cumulative Z curve; traditional boundary value line parallel to the horizontal axis, Z = 1.96; and the rightmost vertical line, RIS line. RIS, required information size.

