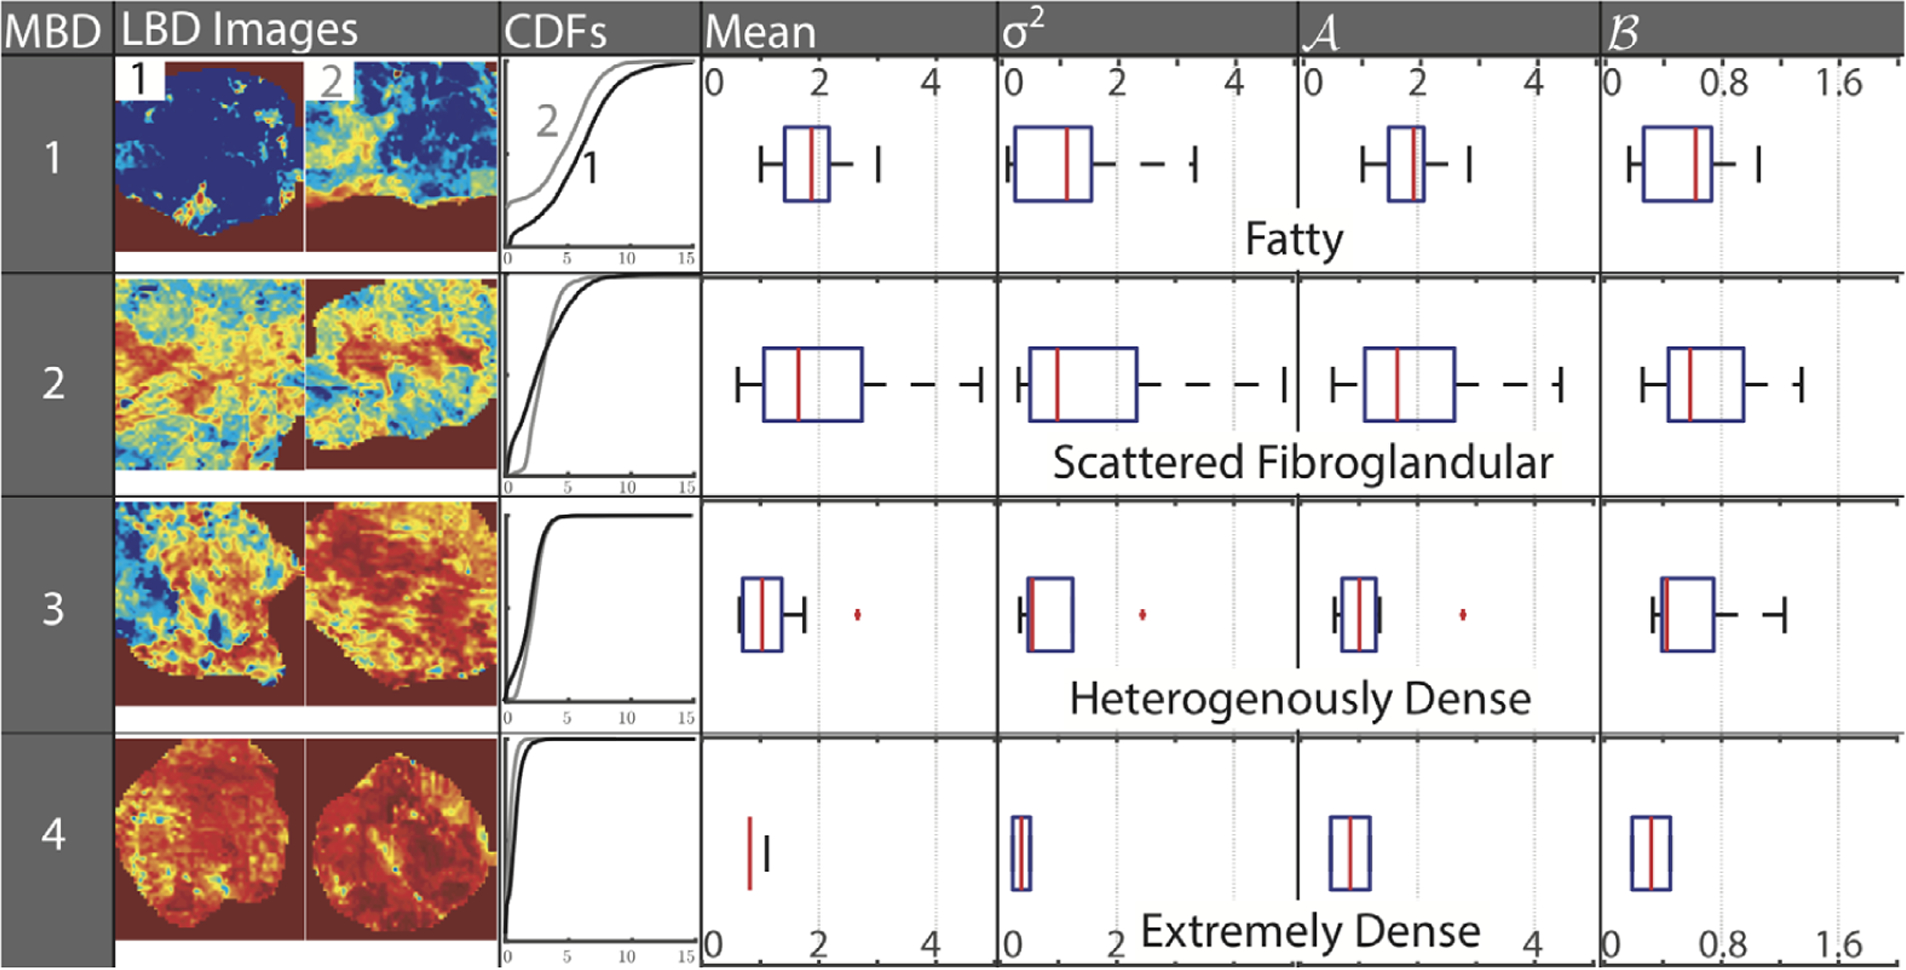
FIGURE 3.

Optical imaging captures local density and heterogeneity reflected in mammographic breast density. Heat-map images of the ratio of β-carotene and scattering, a measure of local breast density (LBD), for increasing mammographic breast density (MBD), along with corresponding cumulative probability distributions (CDF). In each row, the CDF corresponding to the first image (labeled 1 in the top row) is represented by a black CDF curve, while the second image (labeled 2 in the top row) is represented by a gray curve. Optical trends corresponding to each MBD patient cohort are shown as box and whisker plots of the mean, variance (σ2), and the coefficients A and B of the CDF curve
