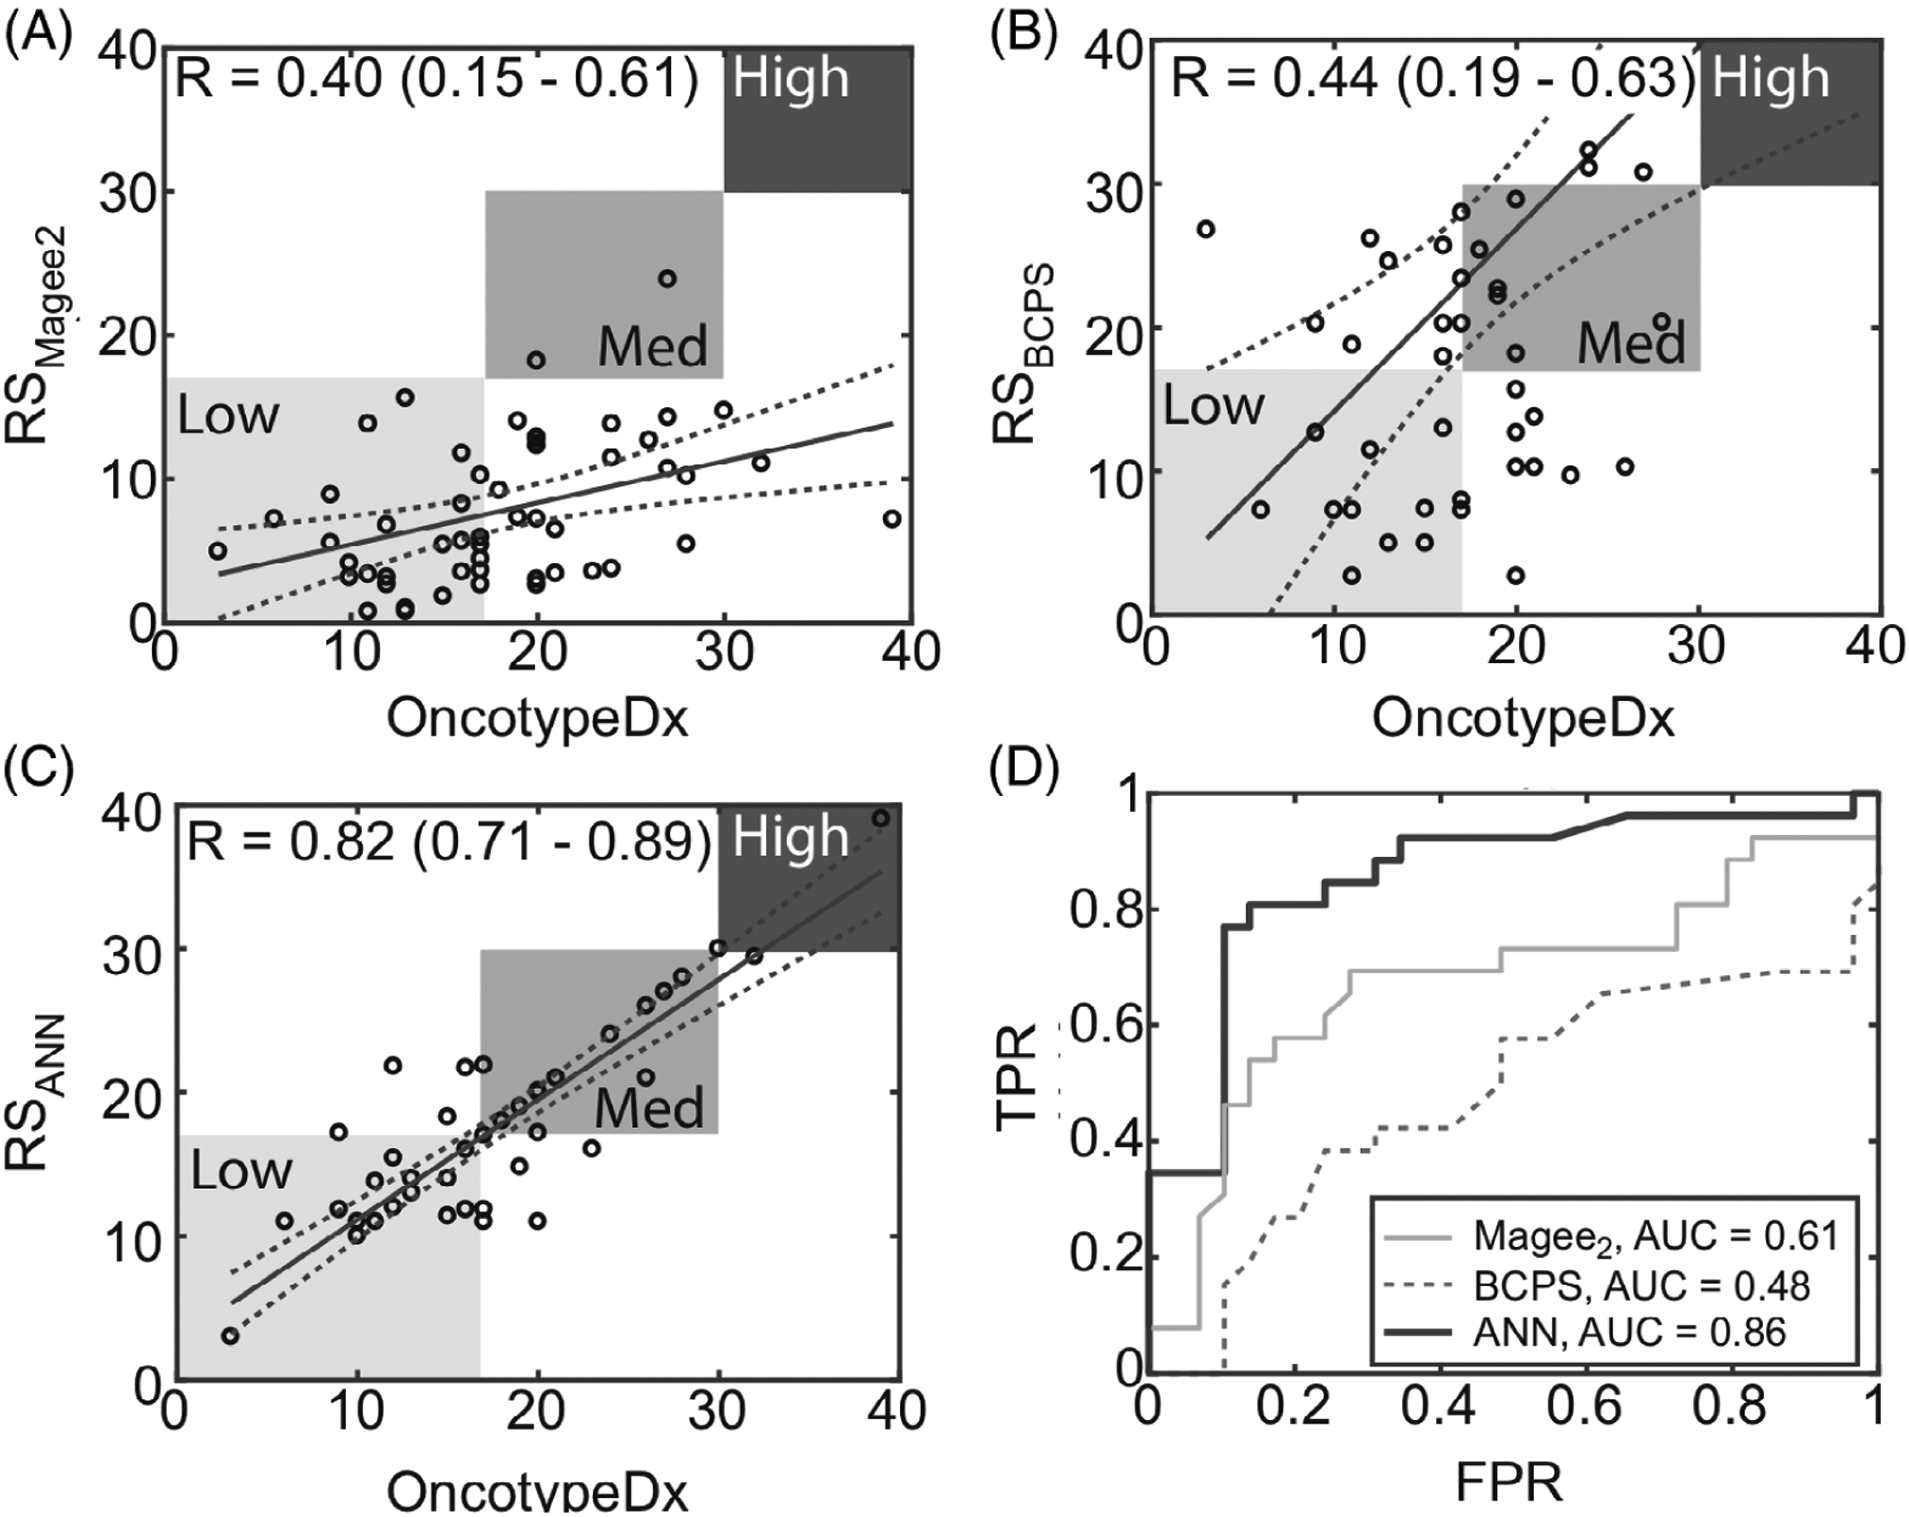
FIGURE 4.

Correlation coefficients and performance of linear and ANN models based on pathology inputs. Regressions based on, A, the Magee2 equation, B, the BCPS method and, C, the ANN model, incorporating only pathological features common to the BCPS and Magee2 models. D, ROC curves for, A, B and, C for classification of low- vs intermediate-risk OncotypeDx recurrence scores
