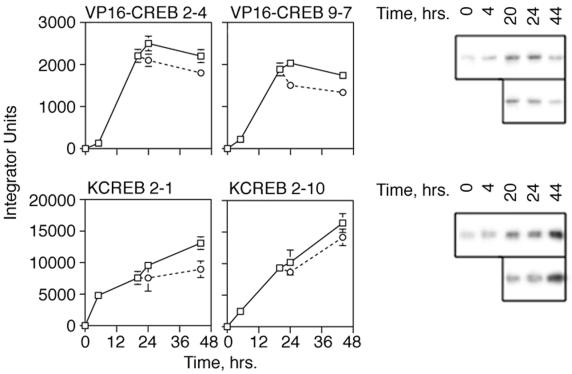
FIG. 3.
Time course of VP16-CREB or KCREB expression in stably transfected 3T3-L1 cells after muristerone induction. 3T3-L1 cells stably transfected with the plasmid, pVgRXR, and either pIND-VP16-CREB or pIND-KCREB were generated as described in Materials and Methods. Individual clones inducibly expressing VP16-CREB, designated 2-4 and 9-7, and clones inducibly expressing KCREB, designated 2-1 and 2-10, were isolated. The expression of VP16-CREB or KCREB was monitored in these clonal cell lines versus time after treatment with muristerone at a final concentration of 10 μM. At 20 h, duplicate wells of cells were refed with medium lacking muristerone (levels indicated by dashed lines) for comparison to cells in medium with muristerone (solid lines). Levels of VP16-CREB and KCREB were measured by separating 25 μg of protein from lysates prepared at the times shown on 10% acrylamide–SDS gels. Proteins were transferred to nitrocellulose membranes subsequently probed with antibodies to VP16 (for VP16-CREB) or CREB (for KCREB). Since the CREB antibody detected both KCREB and endogenous CREB proteins, levels of KCREB expression were corrected for endogenous CREB levels measured in untreated cells (not shown). The optical densities of the bands on the blots was determined by using Scan Analysis Software. A representative blot for each protein is displayed to the right of the graphs.

