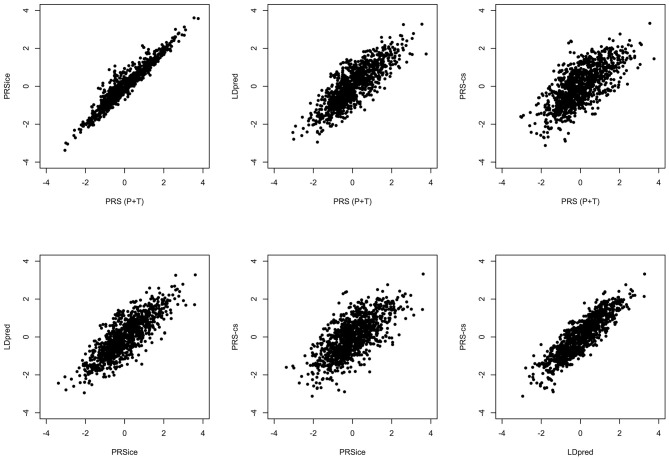
Figure 1.
Comparison of PRS using Different Methodologies; PRS(P+T), PRSice, PRS-CS and LDpred. The PRS is computed for all individuals in HipSci (19) open access data merged with the 1,000 Genomes data (18), scores are weighted using AD GWAS (5) summary statistics. Only SNPs with p ≤ 0.5 are included and the APOE region (chr19: 44.4-46.5Mb) is excluded for all methods.

